
Fig. 3.
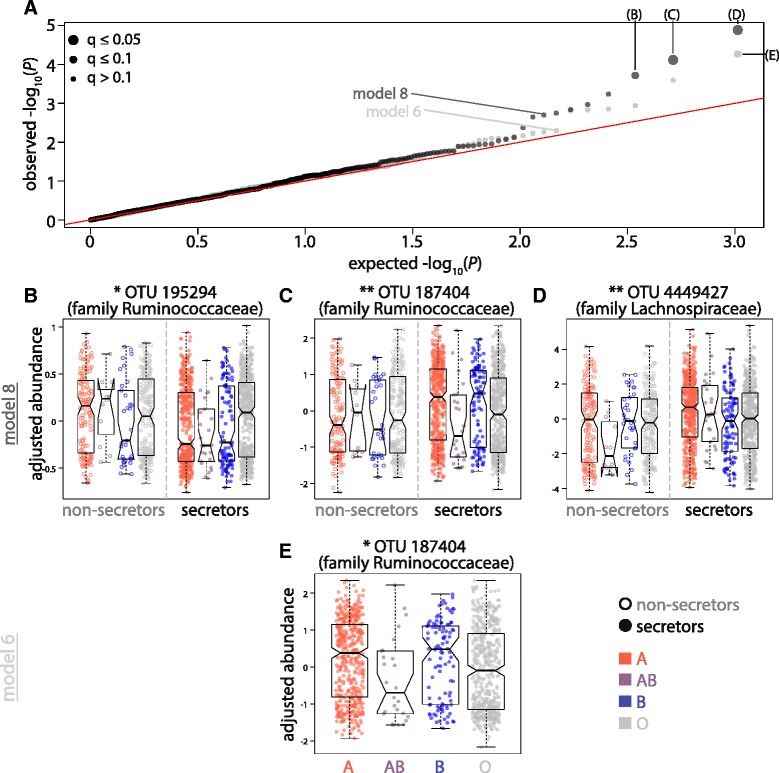
The relative abundances of several Firmicutes OTUs differ in secreting individuals. a QQ-plot displaying the expected –log10(P-value) compared to the –log10(P-value) for all taxa tested in linear mixed models 6 (light gray points) and 8 (dark gray points). Model 6 identified taxa differentially abundant across the four ABO classes in secreting individuals only while model 8 incorporated interaction terms between ABO groups and secretor status. All differentially abundant taxa passing a significance threshold of q ≤ 0.1 are indicated with larger point sizes and the distributions of covariate-corrected, transformed relative abundances of those taxa are displayed in (b-e)