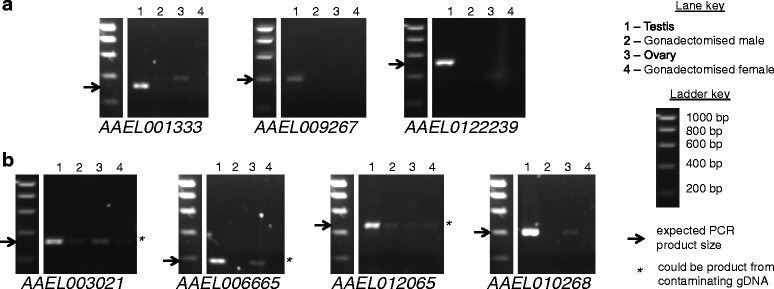
Fig. 2.

Gels showing PCR results for Ae. aegypti expression candidates. a Candidates for which no band of the expected size for the testis sample could be seen in non-testis samples. b Candidates for which a band of the expected size for the testis sample could be seen in a non-testis sample, but it was faint and in the cases indicated by asterisks, could have resulted from contaminating gDNA. Expected PCR product sizes are indicated with arrows. In some cases bands of other sizes are of the expected size for products amplified from contaminating gDNA. Other bands of unexpected sizes may represent isoforms that were not predicted, or non-specific amplification
