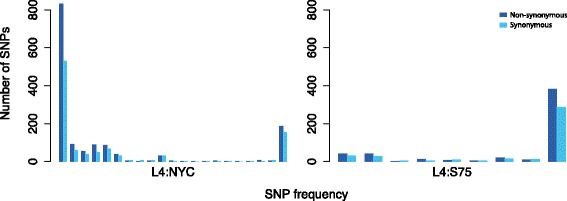
Fig. 3.

Unfolded site frequency spectra for isolates from the S75 outbreak cluster (L4:S75) and non-S75 isolates from the New York City area. Dark and light blue bars indicate the number of non-synonymous and synonymous SNPs at each SNP allele frequency (from singletons on the left to SNPs at fixation on the right)
