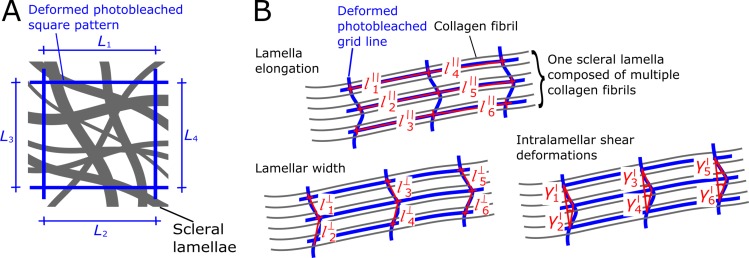
Fig 5. Schematic of photobleached patterns at the tissue- and lamella-level.
(A) Photobleached square pattern (blue) showing the line segments (L1, L2, L3, and L4) used to quantify tissue-level elongations. (B) Photobleached grid pattern showing line segments used to quantify lamellar elongation () and lamellar width changes (), and shear angles () used to quantify interlamellar deformations at the lamella-level.

