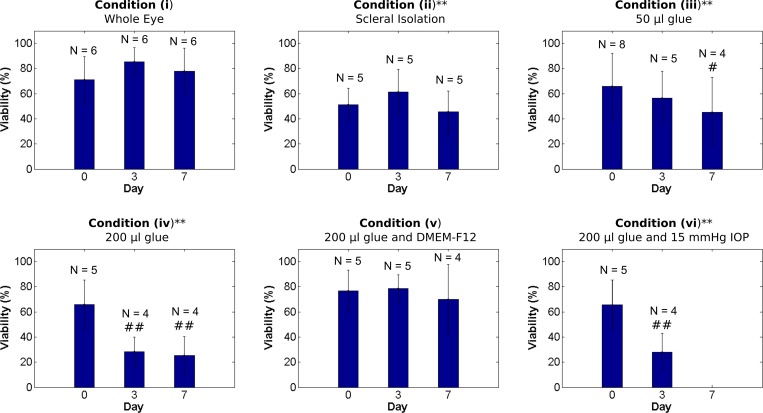
Fig 7. Bar graphs of cell viability in organ culture conditions (i-vi).
* and ** indicate a significant difference in cell viability compared to the positive control condition (i) at the same day in organ culture with P < 0.05 and P < 0.001, respectively (unpaired t-test). # and ## indicate a significant reduction in cell viability compared to day 0 of the same condition with P < 0.05 and P < 0.001, respectively (unpaired t-test).

