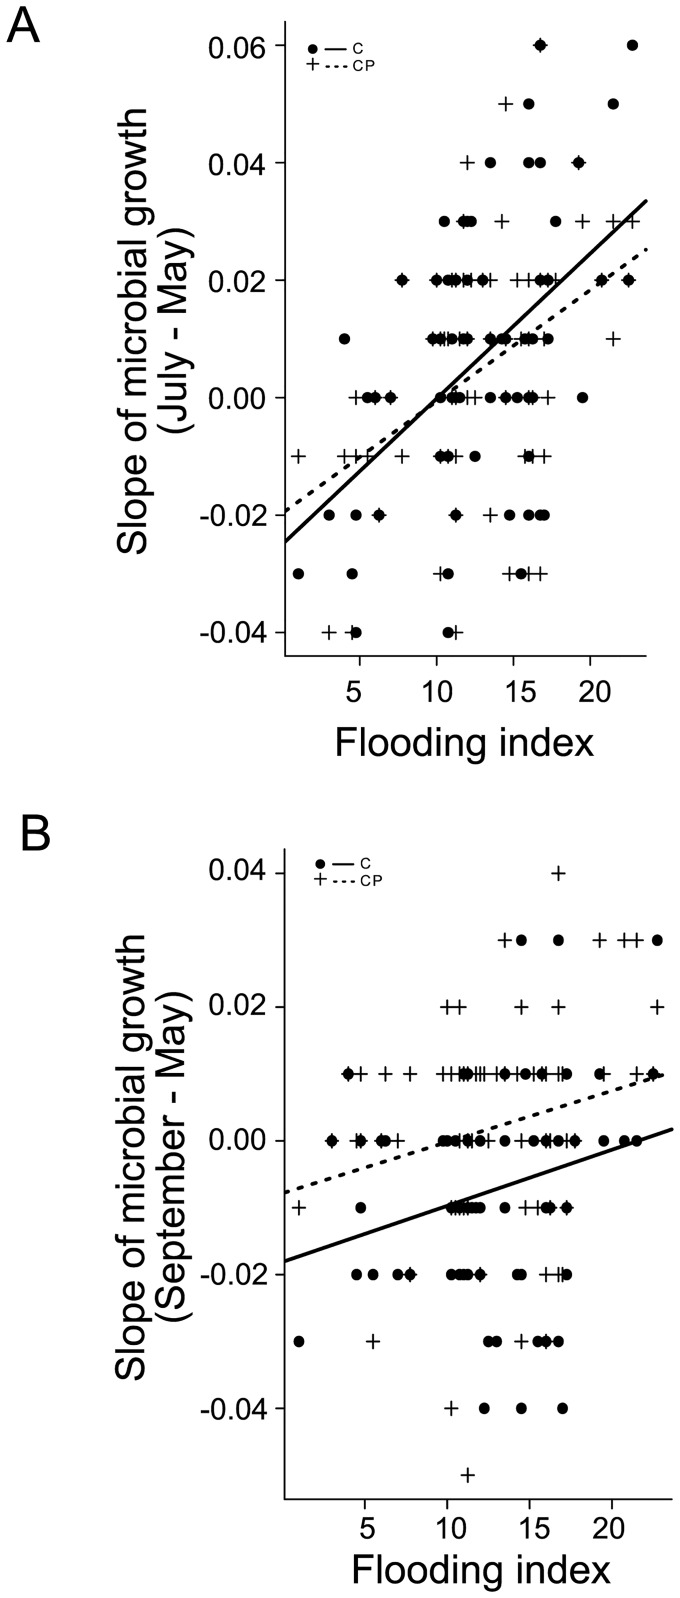
Fig 2. Effects of flooding on C- and CP-supplemented microorganisms.
Variation in slopes of regression lines of microbial growth of carbon-supplemented (C; dots) and carbon and phosphorus-supplemented (CP;cross) microorganisms between (A) May and July (RC2 = 0.19, RCP2 = 0.20; p < 0.01 for both), and (B) May and September (RC2 = 0.04, RCP2 = 0.05; p < 0.05 for both) depending on flooding index.

