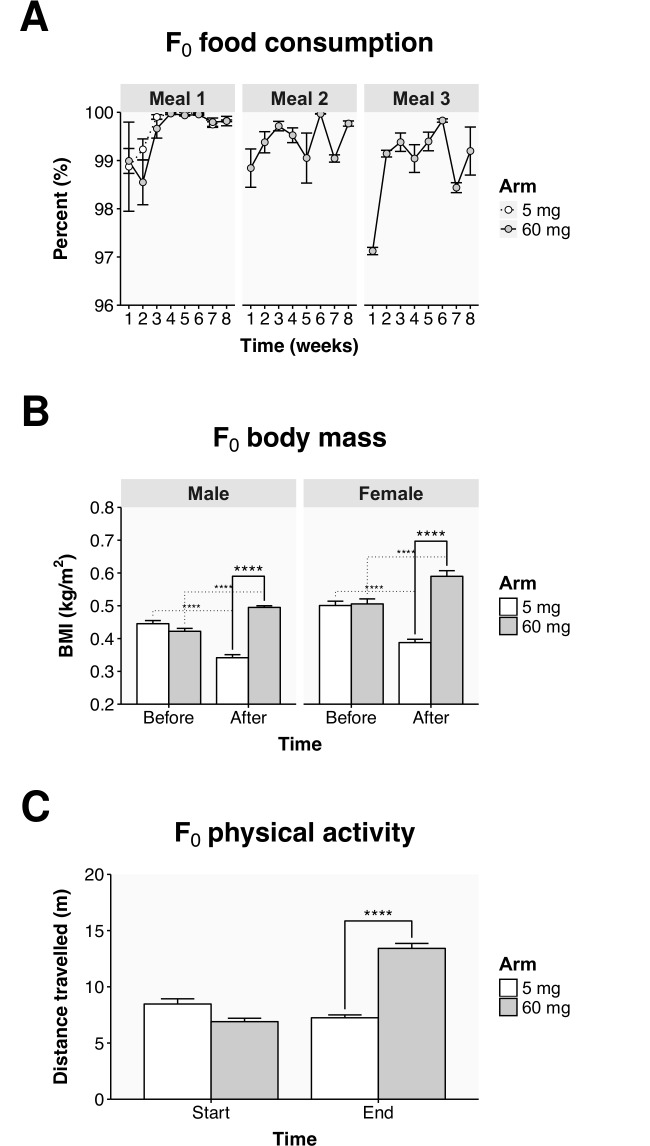
Fig 1. Phenotypic changes resulting from nutrient availability.
Gross phenotypic changes are shown only for group 3, for a comparison of the three groups see S1 Fig. (A) Food consumption over the eight weeks of the dietary intervention for the 5 mg arm (meal 1) and the 60 mg arm (meals 1, 2, and 3). The number of Artemia remaining following feeding is given as a percentage of the number dispensed to each tank, note the scale begins at 96%. (B) The BMI derived from the weights and lengths of every fish in the 5 and 60 mg treatment arms before and after the dietary intervention. The statistical differences are noted between the treatment arms (solid lines) and within each treatment arm (dotted lines), before and after the diet. (C) The total distance travelled in 30 seconds of swimming for the populations of fish in the 5 and 60 mg treatment arms at the start (week 1) and the end (week 8) of the diet. Values represent the mean ± SEM from the three tanks within each group. Statistically significant differences are noted as **** p ≤ 0.0001.

