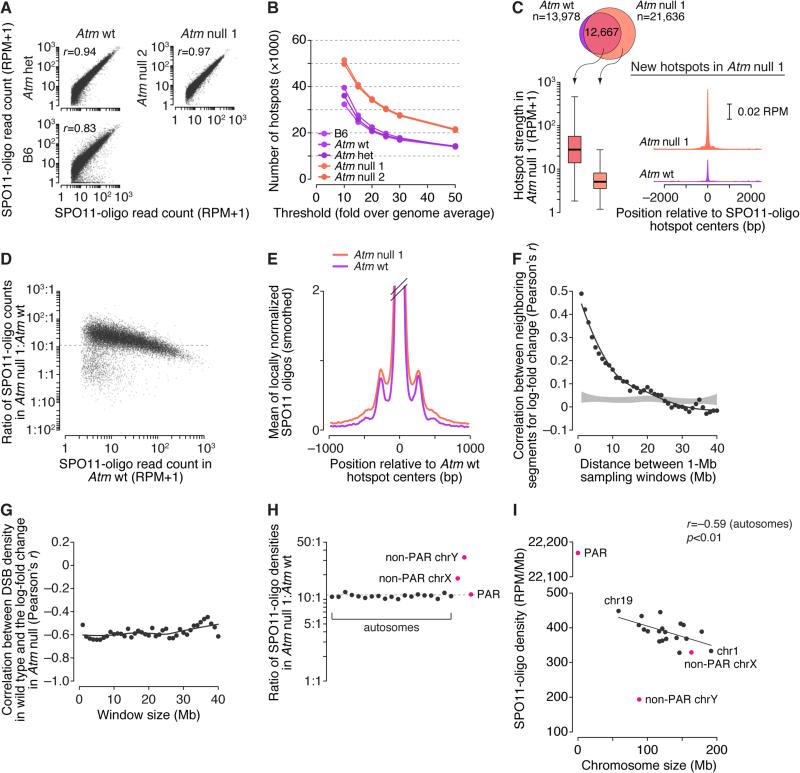
Figure 7. DSB Patterns in the Absence of ATM.
(A) Reproducibility of SPO11-oligo maps. SPO11-oligo read counts were summed in 1001-bp windows.
(B) Atm null spermatocytes display more hotspots than ATM-proficient spermatocytes. Data for B6 are reproduced from Figure 2A.
(C) New hotspots in Atm null are weak hotspots that also yield small numbers of DSBs in wild type. Boxplot is as defined Figure S2A legend; SPO11-oligo profiles were smoothed with a 51-bp Hann filter.
(D) In ATM-deficient spermatocytes, weaker hotspots increase more than stronger hotspots. Each point represents a 1001-bp window around a hotspot called in the Atm wt map (one outlier is not shown). The dashed horizontal line marks the 11.3-fold increase in whole-testis SPO11-oligo levels in Atm null mice (Lange et al., 2011).
(E) Wider average SPO11-oligo distribution around hotspots in the absence of ATM. SPO11-oligo profiles were smoothed with a 51-bp Hann filter.
(F) Local domains of correlated behavior. Each point compares the log-fold change in SPO11-oligo density in 1-Mb segments on autosomes to the log-fold change in neighboring segments the indicated distance away. Shaded area denotes estimated 95% confidence intervals for data randomized within-chromosome.
(G) Domains that are relatively DSB-poor in wild type tend to be more strongly suppressed by ATM. Each point compares the log-fold change in SPO11-oligo density in Atm null to the SPO11-oligo density in Atm wt when autosomes are segmented into non-overlapping windows of the indicated size.
(H) In the absence of ATM, DSB densities increase more on the non-PAR segments of the sex chromosomes than on autosomes or the PAR.
(I) In Atm null spermatocytes, SPO11-oligo density remains negatively correlated with chromosome size, and the X chromosome more closely matches expectation from its size.
See also Figure S7.

