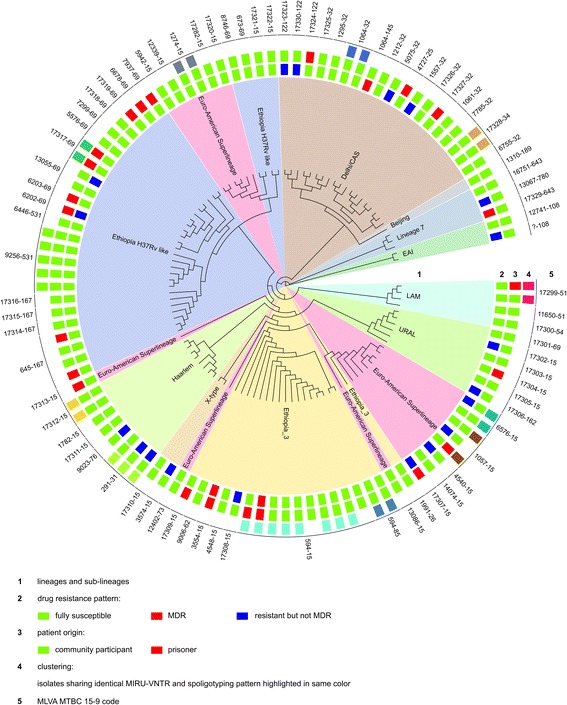
Fig. 1.

Radial UPGMA tree based on the copy numbers of MIRU-VNTR 24-loci. Inner circle: lineages and sub-lineages, (EAI - East African Indian, LAM - Latin American Mediterranean, CAS - Central Asia). Small rectangles in the second circle: drug resistance pattern of the individual isolates (green - fully susceptible, red - MDR, blue - resistant but not MDR). Small rectangles in the third circle: origin of the patient (green - community participant, red - prisoner). Small rectangle in the fourth circle: clustering according to 24-loci MIRU-VNTR and spoligotyping pattern analysis; isolates with identical genotyping profile are highlighted in same color. Outer circle: MLVA MTBC 15–9 code
