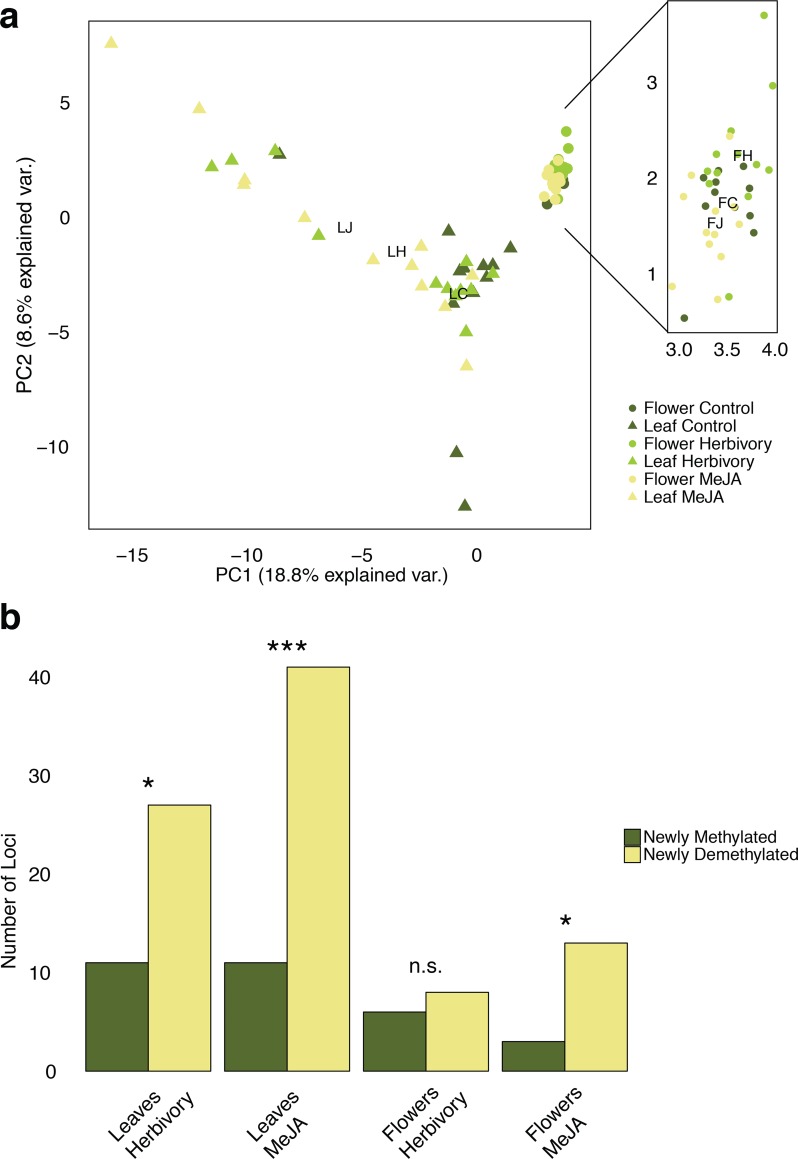
Fig 1. Treatment effects on DNA methylation Fig 1a: PCA of differentiation in methylation sensitive loci state shows a clear separation of samples from leaves and flowers.
Methylome changes upon the different treatments (control, herbivory, and MeJA) were significant in both leaves and flowers, but much more prominent in leaf tissue than in flower tissue. Centroid positions of the control -, herbivory-, and MeJA group are indicated with LC, LH, and LJ for the leaf samples, and with FC, FH, and FJ respectively for the flower samples. Fig 1b: Number of loci detected with locus-by-locus AMOVA in both tissues and treatments with either a significant methylation gain (change from an unmethylated to an external, internal, or hypermethylated state as well as change from an external or internal to a hypermethylated state) or methylation loss (change from an external or internal to an unmethylated state as well as change from a hypermethylated to an external, internal, or unmethylated state). Results of the two-sided χ2-tests: Leaves Herbivory: χ2 = 5.921, P = 0.015; Leaves MeJA: χ2 = 16.173, P<0.001; Flowers Herbivory: χ2 = 0.071, P = 0.789; Flowers MeJA: χ2 = 5.063, P = 0.024 (α = 0.05).

