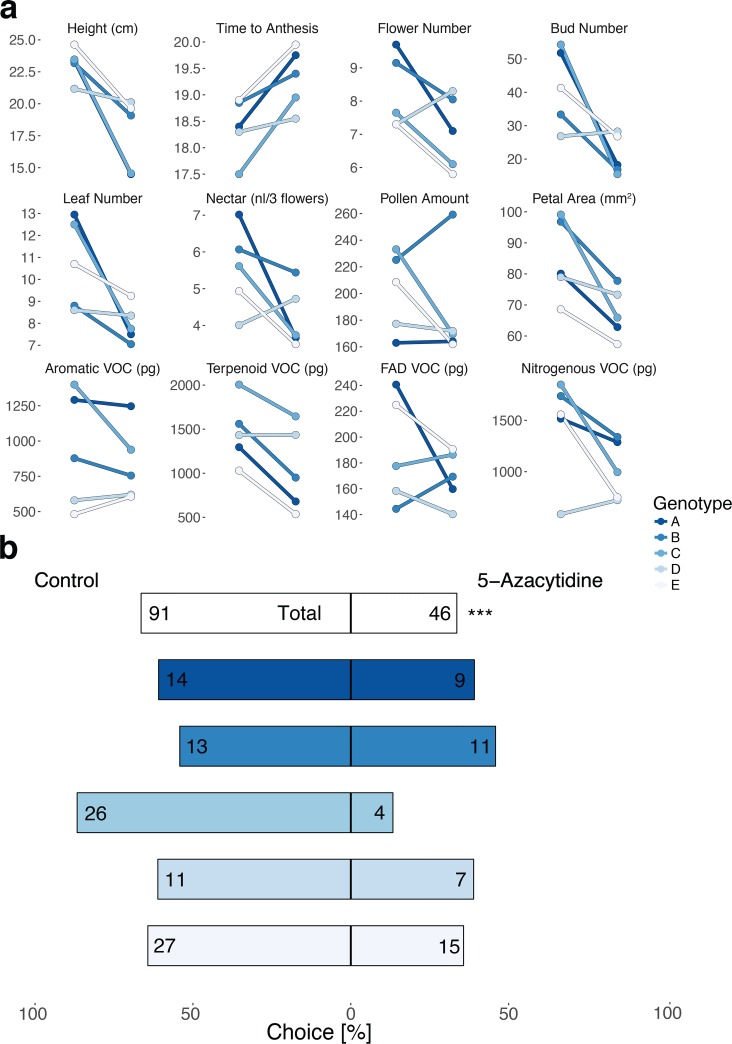
Fig 3. Effect of DNA demethylation on plant morphology, floral volatiles, and pollinator choice Fig 3a: Plots showing treatment × genotype interactions on morphological traits and floral volatiles (VOC).
A comparison of trait divergence between treatment (left points in each line plot) and control group (right points) across all plant genotypes shows pronounced treatment × genotype interactions for all traits (lines connecting both points; e.g. stronger treatment effects in genotype C, and weaker effects in genotype D). Significant treatment effects are indicated in S3 and S4 Tables. Fig 3b: Barplot showing the choice of B. terrestris in the two-choice assays between control and 5-azaC treatment (percentage and total choices) for all plants as well as for individual genotypes. In total, control plants were favoured over 5-azaC-treated plants with 66.4% to 33.6% landings (top bar with significance asterisks, α = 0.05). The preference for control plants was dependent on plant genotype and very pronounced in genotype C (bars below).

