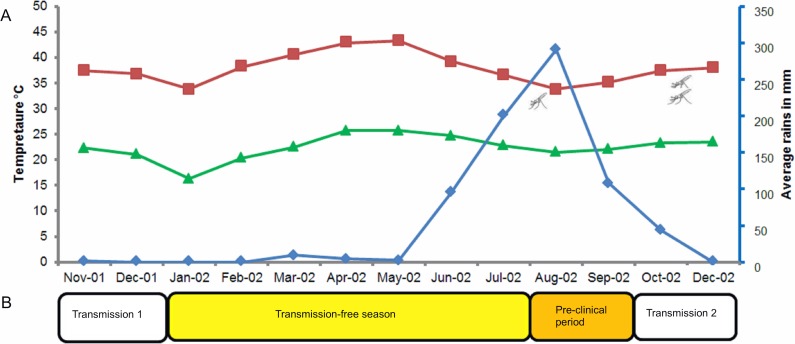
Fig 1. Seasonality of annual rains, mosquito abundance, and categorisation of seasons.
(A) Monthly average rainfall in mm (blue line), maximum (red line) and minimum (green line) temperature in the study area between November 2001 and December 2002 (Meteorological Authority, Sudan). Mosquito symbols indicate the expected appearance of mosquitoes (July 2002) and peak mosquito densities (October 2002). (B) Distinct epidemiological phases of malaria transmission; transmission season 1 (November to December 2001), transmission-free season (January to July 2002), pre-clinical period (August and September 2002) and transmission season 2 (October and December 2002).

