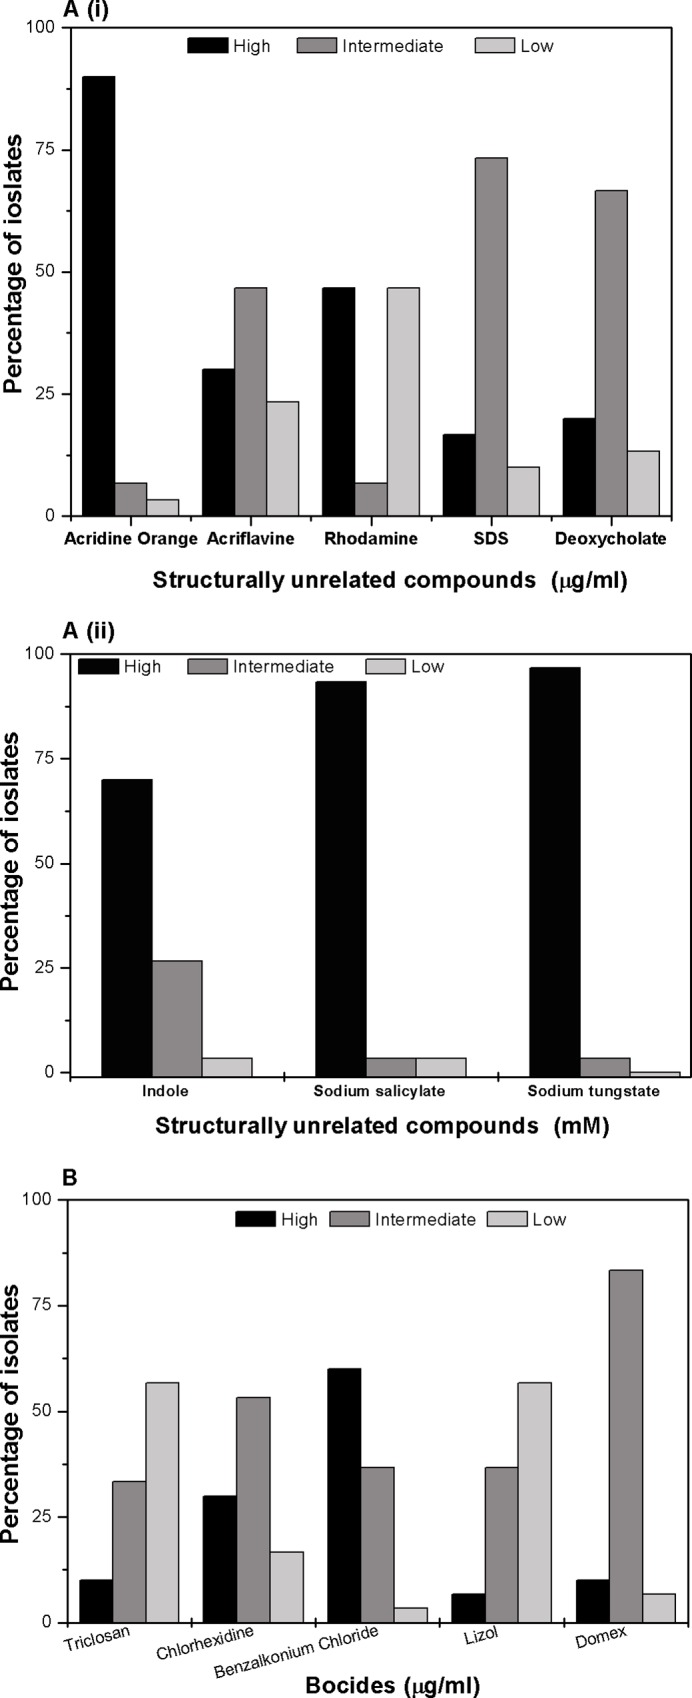
Fig 4. Resistance to SUCs and hospital based disinfectants.

(A) i) Percentage of isolates with different level of resistance to different SUCs is shown. Percentage of strains having different MIC values for ACR: acriflavine, AO: acridine orange, RHO: rhodamine, SAF: safranin, EtBr: ethidium bromide, SDS: Sodium dodecyl sulphate and deoxycholate are plotted here. ii) Percentage of strains having different MIC values for IND: indole, SS: sodium salicylate and ST: sodium tungstate is also shown here. The bar graph represents the mean of three independent experiments. (B) Graphical representation of percentage of isolates with different level of resistance with different biocides. In this study, we grouped the isolates in three different resistance level for each biocides viz. strains with high MIC values are grouped as highly resistant, intermediate MIC value as intermediately resistant and low MIC value as sensitive. For this study, we used the following biocides: TRI: triclosan (high MIC value– 0.5 μg/ml or more, intermediate MIC value- 0.1 μg/ml to 0.05 μg/ml and low MIC value- 0.01 μg/ml or less); CHX: chlorhexidine (high MIC value 51.2µg/ml to >102.4 μg/ml, intermediate MIC value 12.8 μg/ml to 25.6 μg/ml and low MIC value3.2 μg/ml or less); BZC: benzalkonium chloride (MIC values similar as CHX); lizol (high MIC value 1.2% to 1.6%, intermediate MIC value 0.4% to 0.8% and low MIC value 0.2% or less); and domex (MIC values similar as lyzol). The bar graph represents the mean of three independent experiments.
