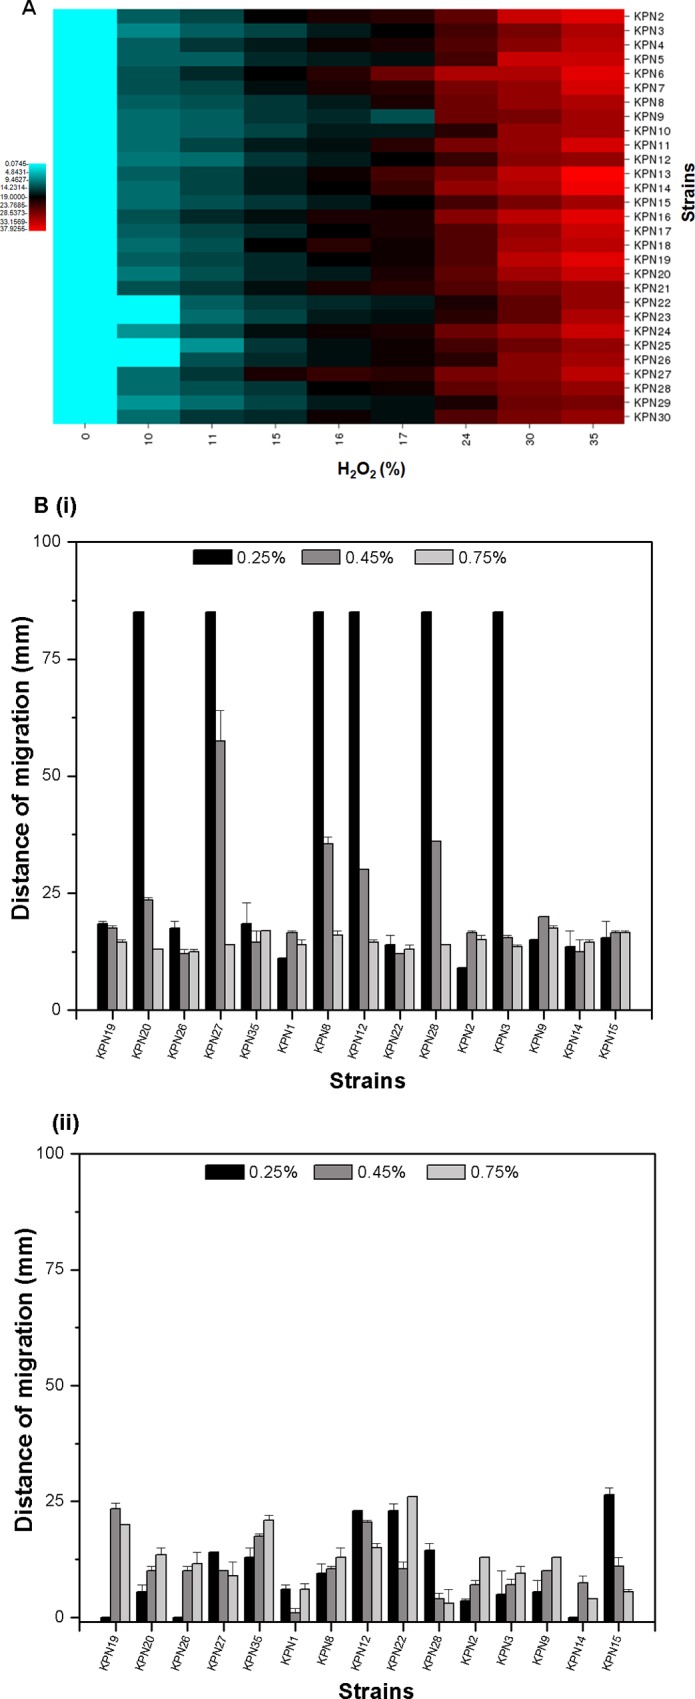
Fig 6. Oxidative stress and bioflim formating assay in K. pneumoniae strains.

(A) Diagram showing the zone of inhibition in different strains due to the different concentration of H2O2. In this study 0%, 0.1%, 1%, 3%, and 10% of H2O2 were used as oxidative stress inducing agent. The diagram represents the mean of three independent experiments. (B) Biofilm formation by the K. pneumoniae isolates are shown here: i) tubes showing stained biofilm rings in few representative isolates ii) graphical presentation of biofilm formation among the isolates is shown as the ratio of OD570nm and OD600nm. The bar graph represents the mean of three independent experiments.
