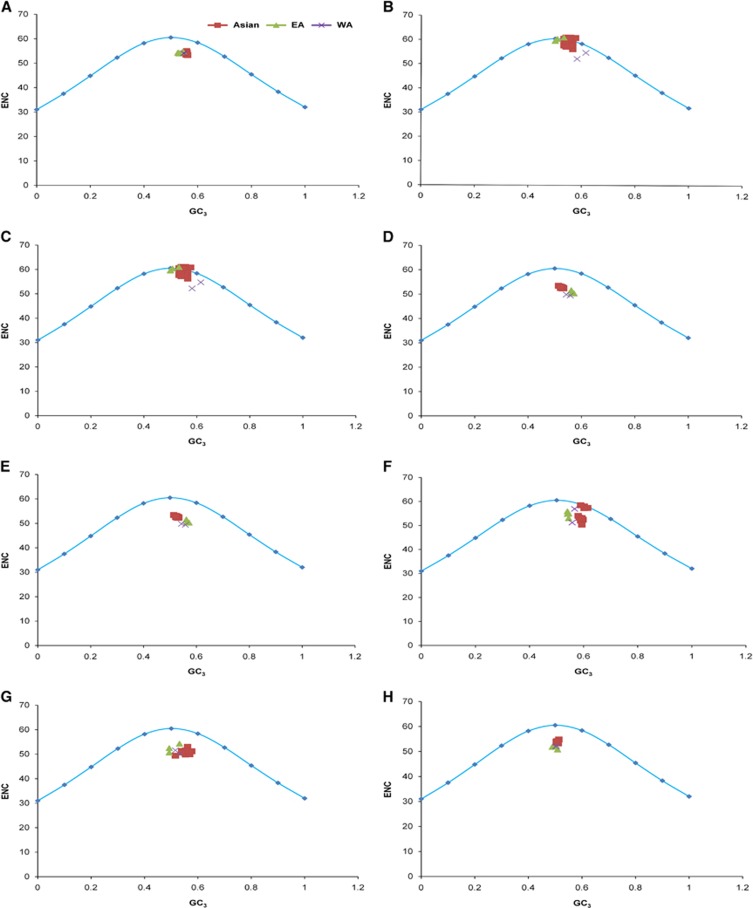
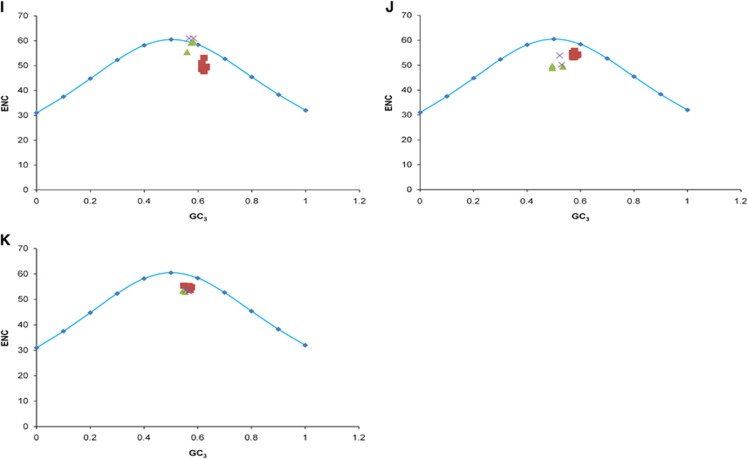
Figure 3.
ENC–GC3 plots. The curve indicates the expected codon usage if GC compositional constraints alone account for the codon usage bias. (A) Whole genome. (B) C. (C) prM. (D) E. (E) NS1. (F) NS2A. (G) NS2B. (H) NS3. (I) NS4A. (J) NS4B. (K) NS5. The description of color coding is same as that of A.


