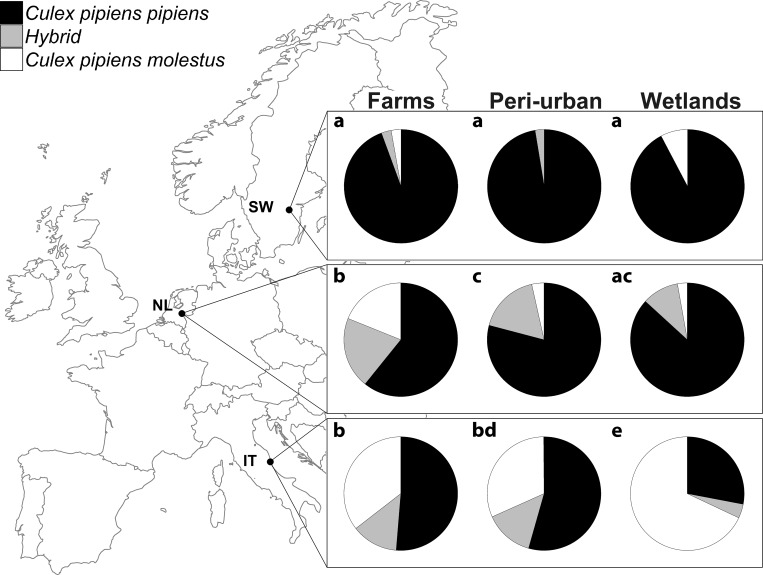
Fig 2. Within-effect of habitat within each of the three countries on the ratio of Culex pipiens biotypes and their hybrids (rows), and within-effect of country within each habitat type (columns).
The sample size for each pie chart ranges between n = 26–115. Letters display significant differences between ratios shown in rows and columns, at a significance level of p < 0.05. SW = Sweden, NL = The Netherlands, and IT = Italy.

