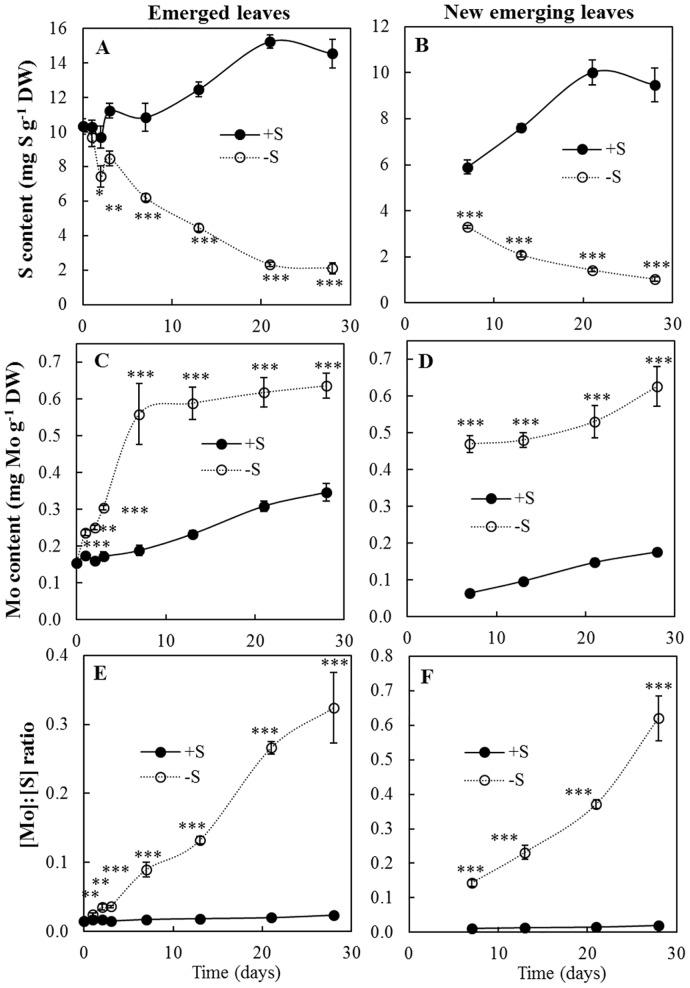
Fig 4. Kinetic of (A-B) S and (C-D) Mo contents (mg g-1 DW) and (E-F) the [Mo]:[S] ratio in emerged (on the left) and new emerging (on the right) leaves of B. napus from control (+S, black line) or S-deprived (-S, dashed line) plants.
Data are given as the mean ± s.e. (n = 4). *, ** and *** indicate significant differences between control and S-deprived plants for P<0.05, P<0.01 and P<0.001, respectively.

