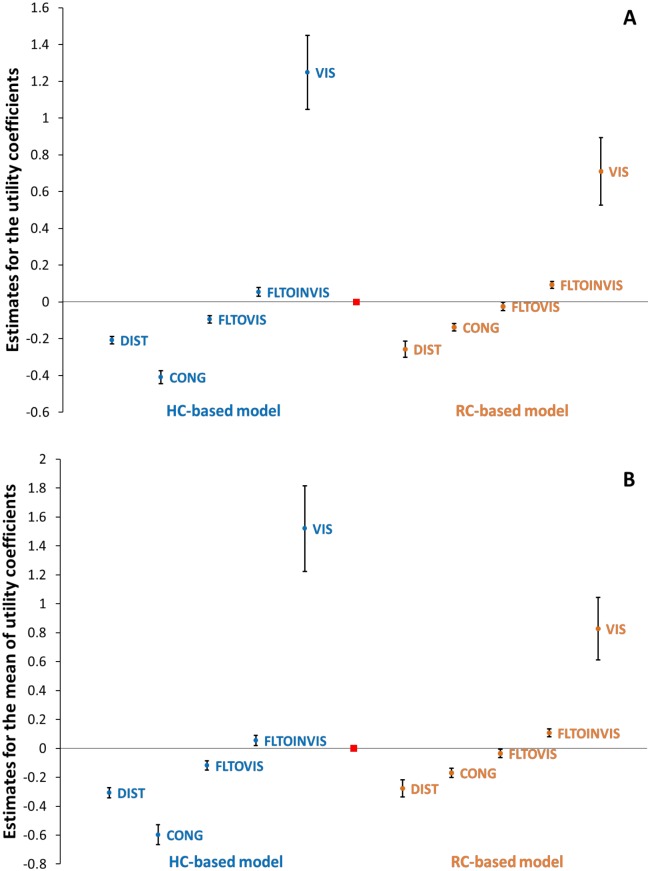
Fig 5. Comparing the model estimates obtained from the HC against RC data.
The error bars represent the 95% confidence interval of each estimate. The red square separates the HC-based estimates from those obtained from the RC observations. (A) Estimates obtained from a FP-MNL model specification. (B) Estimates obtained from a RP-MNL model specification (the mean of utility coefficients). Note that according to the scale difference of the models derived from the HC and RC segments, comparison between the corresponding “magnitude” of the individual estimates between the HC and RC contexts would not be meaningful and is not intended by these graphs. Only, the sign, significance and the estimate patterns of the parameters are meaningfully comparable here.

