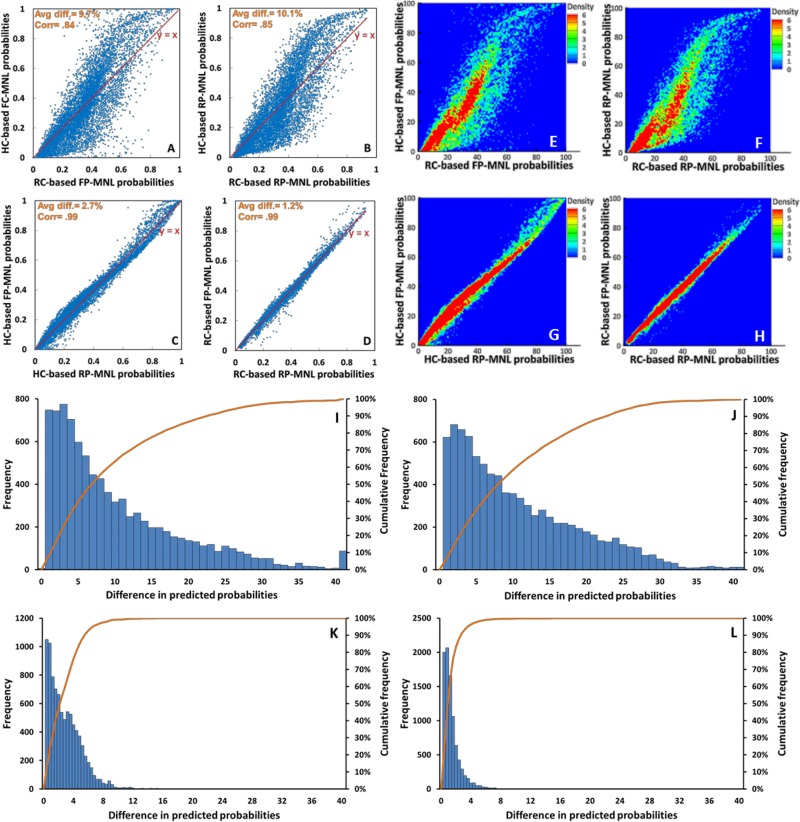
Fig 6. The impact of the context dependency (HC versus RC) and preference heterogeneity on the model predictions.
Each point in the scatterplots (A)-(D) is associated with one alternative exit in one choice situation extracted from the field-type trials. The coordinates of each point are the probabilities predicted for that alternative (exit) by the model represented by the two axes. Figures (A) and (B) measure the effect of context dependency on predictions by making pairwise comparisons between the predictions of the counterpart models obtained from the real and hypothetical experiments. Figures (C) and (D) measure the effect of accommodating preference/perception heterogeneity on the predictions by making pairwise comparisons between the predictions obtained from models that can and cannot accommodate the heterogeneity effect (estimated on the same data). The average of absolute differences (Avg diff.) and the correlations (Corr) between each pair of data series are shown on each scatter plot. Figure (E)-(H) color-code the concentration of the points (the number of points per 1×1 square) in the scatterplots presented in Figures (A)-(D) respectively. Figures (I)-(L) show the distribution of the absolute differences between the predicted probabilities of each model pair compared in figures (A)-(D) respectively (i.e. the distribution of the absolute differences between the values of the x and y coordinates of the points shown in figures (A)-(D)).

