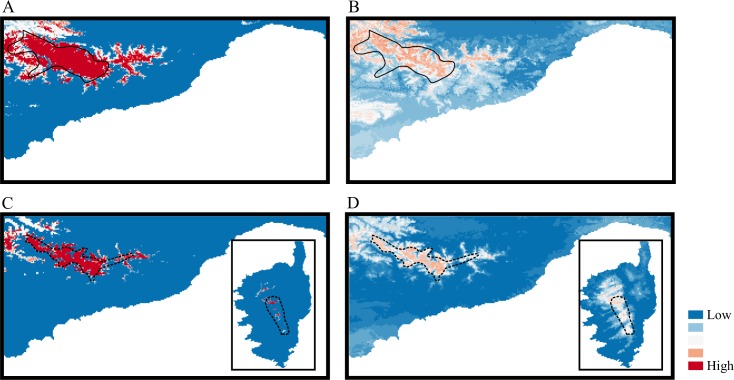
Fig 2.
Maps showing the consensus among the 6 binary maps of the current distribution (A and C) and of the 18 binary maps of the Last Glacial Maximum distribution (B and D; LGM ~ 21 kya) for S. cordifolia (A and B) and V. argenteria (C and D). Models were obtained using six algorithms (MARS, GLM, CTA, FDA, RF and MAX). LGM models are obtained using three palaeoclimate data (MIROC, CCSM and MPI). The inferred continuous probability values were converted to binary using TSS threshold. Red indicates greatest consensus among models and blue indicates lowest consensus among models. Current known distribution area of S. cordifolia (continuous black line) and V. argenteria (dotted black line) is reported.

