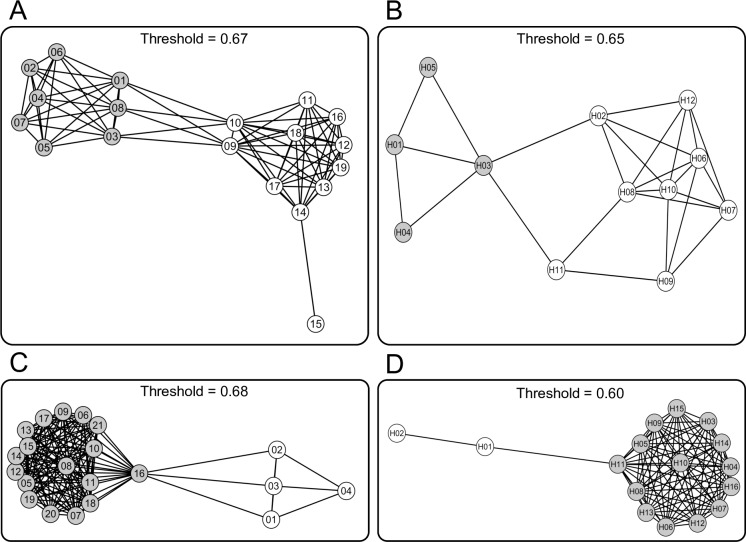
Fig 3. Percolation network obtained combining distance matrices of indels and substitutions.
Relationships among populations (A and B) and haplotypes (C and D) are showed for S. cordifolia (A and C) and V. argenteria (B and D). The network was built connecting distances lower than the estimated percolation threshold (reported in the figure). Groups (i.e., subsets of nodes conforming densely connected subgraphs) are represented in different grey tones.

