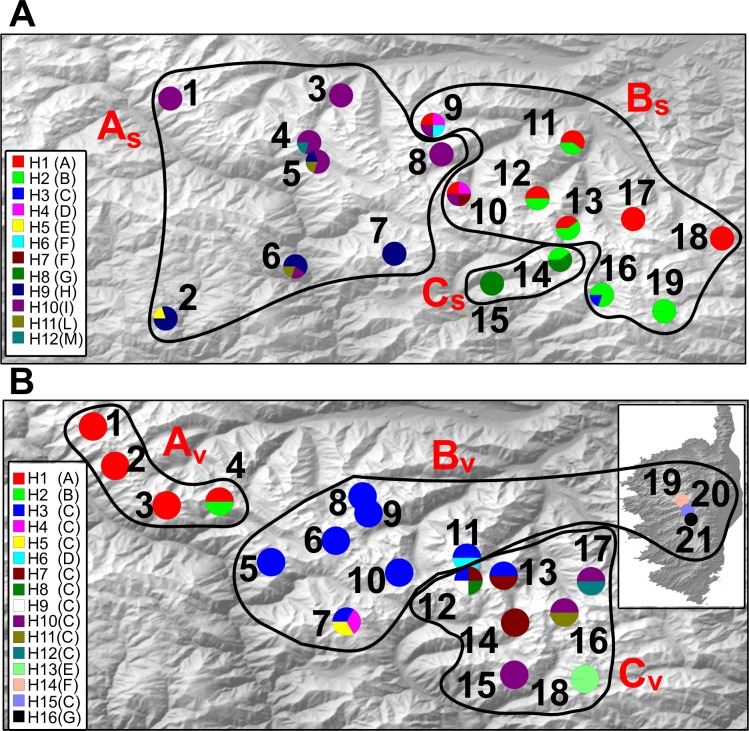
Fig 5.
Geographical distribution of haplotypes across sampled populations of S. cordifolia (A) and V. argenteria (B). Pie charts represent haplotype proportions. Haplotype codes correspond to those in Table 1. Population groups identified by SAMOVA are delimited by continuous black lines and named by capital red letters for S. cordifolia (AS-CS) and V. argenteria (AV-DV).

