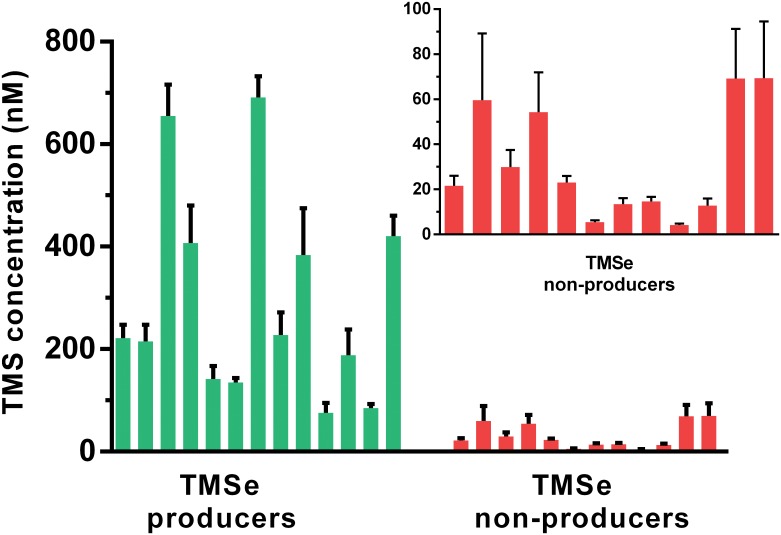
Fig 1. Urinary levels of trimethylsulfonium in the volunteers of the TMSe producers and TMSe non-producers group.
Each bar shows the mean of trimethylsulfonium urinary concentration for 5 consecutive days and the standard error of the mean (SEM). The inset shows a zoomed-in portion of the graph for TMS levels in TMSe-nonproducers.

