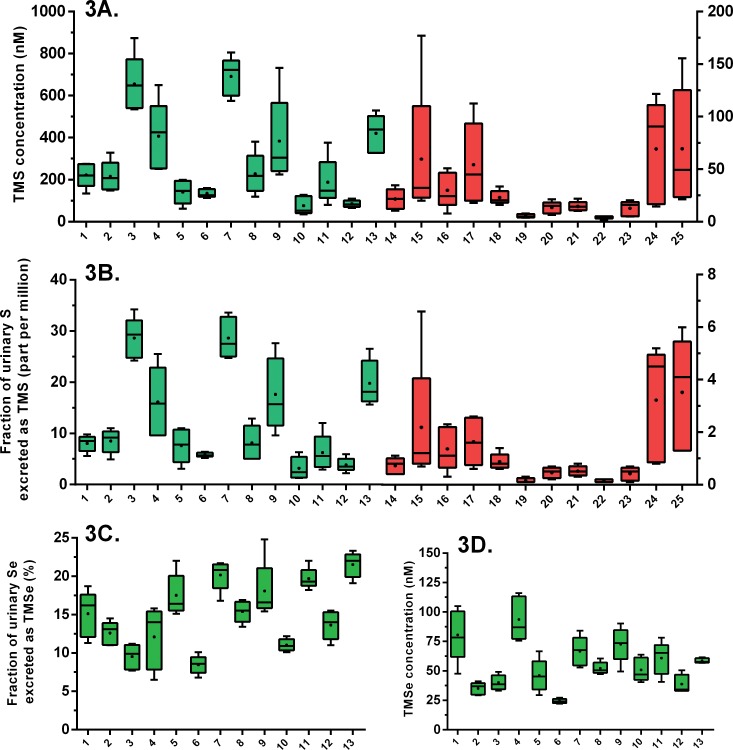
Fig 3. Box and whiskers plot of the concentration of urinary trimethylsulfonium (A), the fraction of total urinary sulfur excreted as trimethylsulfonium (B), fraction of total urinary selenium excreted as trimethylselenonium by TMSe producers (C), and the urinary concentration of trimethylselenonium in TMSe producers (D).
Volunteers 1–13 are the TMSe producers (shown in green bars). Volunteers 14–25 are the TMSe non-producers (shown in red bars). TMSe was detected in the TMSe non-producers (LOD = 0.8 nM) but always fell below the limit of quantification (LOQ = 2.6 nM). The graphs show the minimum, maximum, 25% percentile, 75% percentile, arithmetic mean (dot), and median (line) of five consecutive morning urine samples from each volunteer. Concentrations were normalized according to specific gravity.

