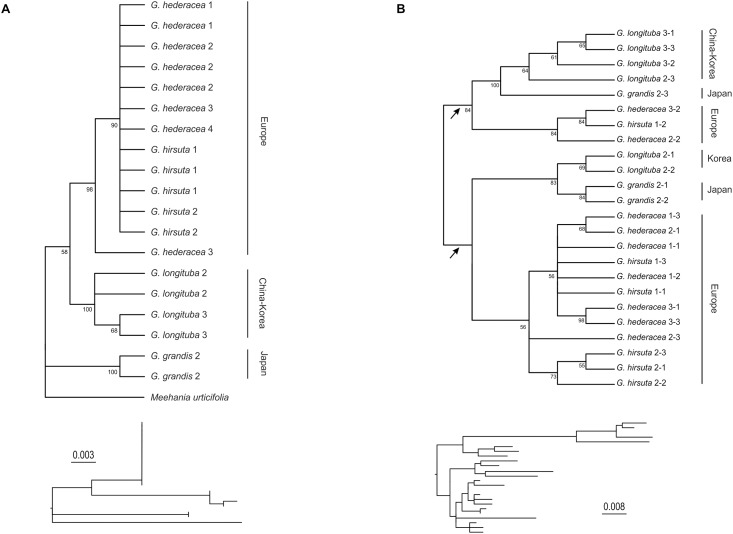
Fig 4. Phylogenetic trees derived from maximum likelihood analysis of ITS (A) and 5S rDNA NTS (B) sequences.
Shown are cladograms (above) with bootstrap support values > 50% and, below, phylograms (topology only) with scale bars (substitutions per site). Numbers after species names refer to different accessions (Table 1) and to clone numbers (after dash). Arrows in (B) indicate two monomer types.

