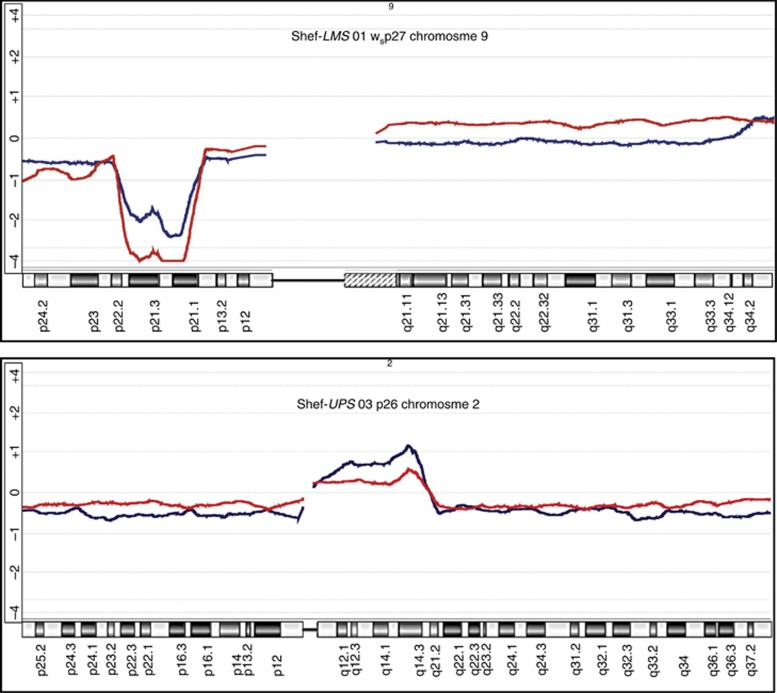
Figure 3.
Selected chromosome copy number profile comparisons of soft-tissue sarcoma (STS) primary cell lines with their parent tumours.Ideograms of specific chromosomes are as shown at the top of each panel with the corresponding regions at the bottom. The overlaid red and blue lines represent the moving average of log2 ratios (vs normal genomic DNA) of the cultured cells and parent tumour tissue, respectively. Deviations above and below the horizontal baseline represent amplifications and deletions, respectively. Amplitude of deviation shows the relative log2 ratio and represents relative DNA copy number. Note the close similarity and/or near-identical breakpoints in the moving average patterns in each case. Copy number analysis was performed on the Agilent 4 × 180K DNA microarray platform and data analysed using Agilent Genomic Workbench Software v.6.0 (Agilent Technologies).

