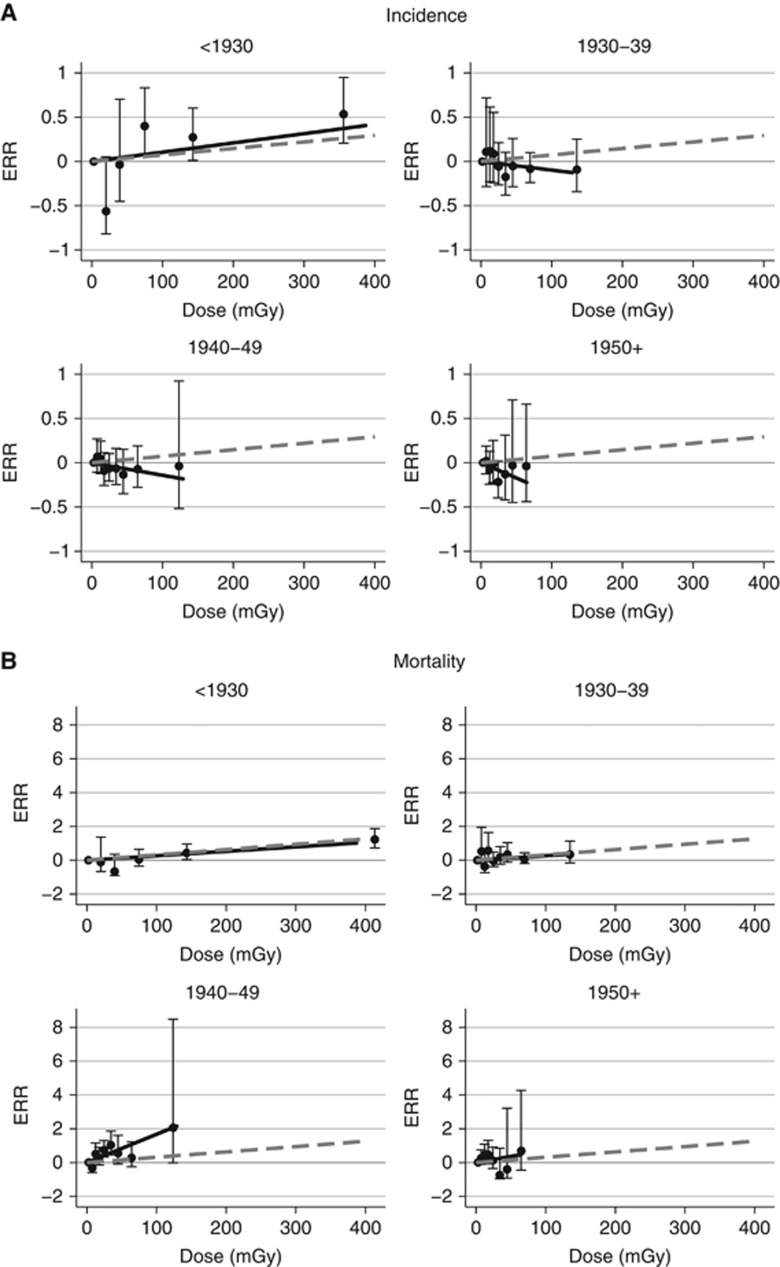
Figure 1.
Birth cohort-specific fitted breast cancer incidence (A) and mortality (B) dose–response curves (solid lines) with categorical excess relative risk estimates (ERRs) (closed circles) and 95% confidence limits. The dashed lines are the fitted linear dose–response curves assuming that the ERR is the same in all birth cohorts.

