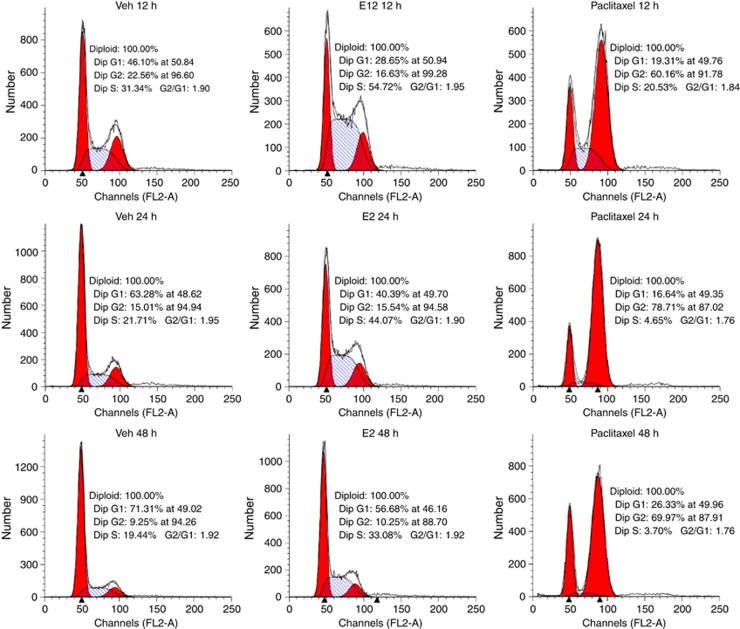
Figure 7.
Cell cycle analysis of the effects of E2 and paclitaxel in the MCF7:5C cells. Representative cell cycle profiles of MCF7:5C cells treated with either 0.1% ethanol (Veh), E2 (1 nM) or paclitaxel (1μM) for 12, 24 and 48 h. FL2-A represents the intensity of PI, and the y-axis represents the cell number.

