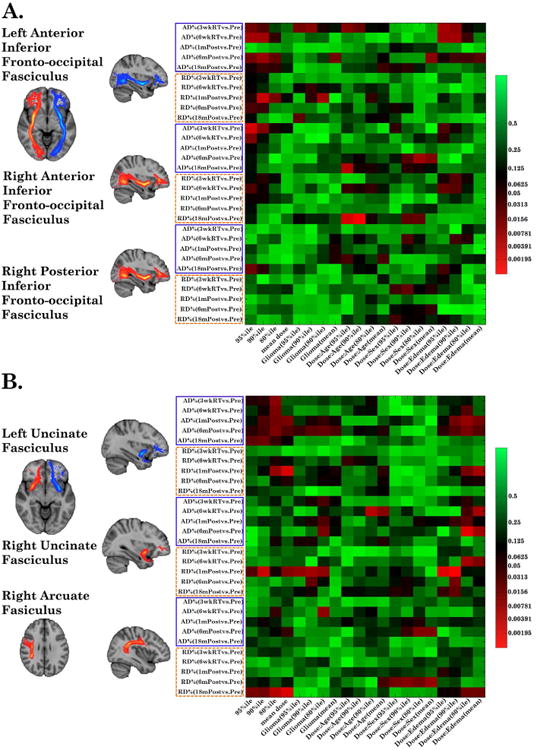
Figure 3.

Heatmaps of linear fixed-effect models. The vertical axis represents dependent variables (sorted first by ΔAD%/ΔRD% then by time points). The horizontal axis depicts independent variables of four dose metrics, glioma, and three interaction co-variables. Examples of WM bundles responded to the maximum dose and to both the maximum and mean doses are displayed in (A) and (B), respectively.
