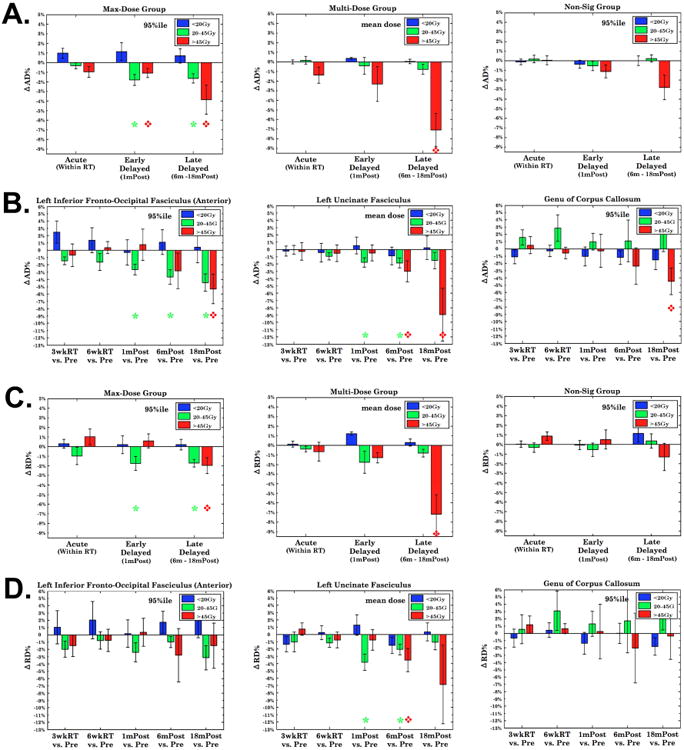
Figure 4.

Dose-dependent longitudinal ΔAD% and ΔRD% for the Max-Dose (left), Multi-Dose (middle) and Non-Sig group (right column). ΔAD%/ΔRD% were averaged over voxels receiving doses higher than the 95%ile on bundles for the Max-Dose and Non-Sig groups, and over all voxels for the Multi-Dose group. ΔAD%/ΔRD% in 4A and 4C were further averaged over the bundles within each group. ΔAD% (4B) and ΔRD% (4D) from the IFOF, UNC and GCC represent the three abovementioned groups. Red diamonds and green stars: significant at the time point for respective high- and medium-dose levels.
