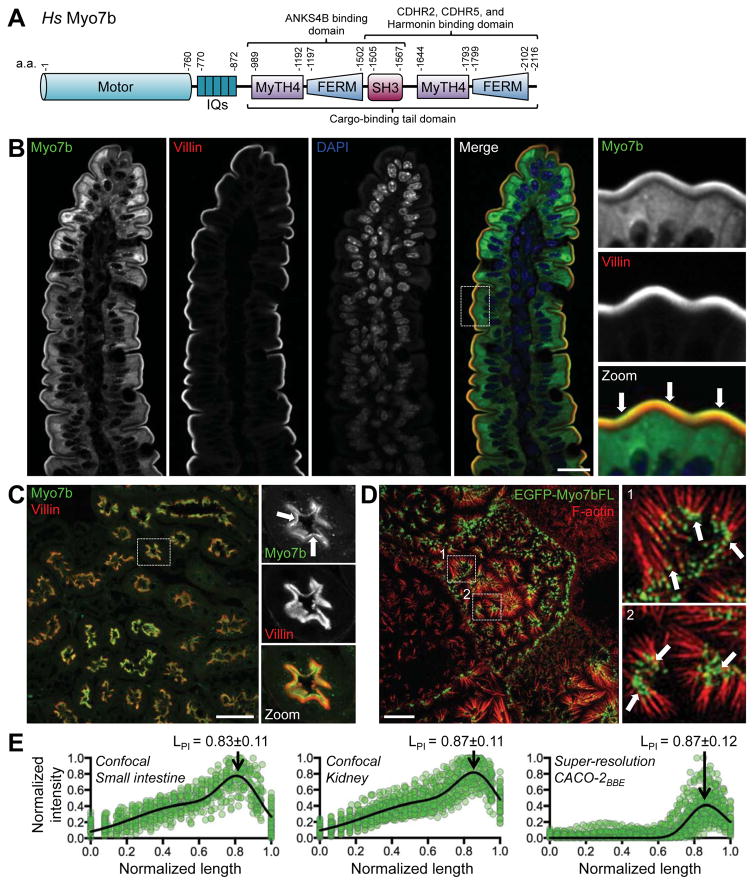
Figure 1. Myo7b localization in native tissue and CACO-2BBE cells.
(A) Domain diagram of full-length Myo7b. Numbers indicate amino acids. (B) Confocal images of mouse small intestinal tissue stained for Myo7b (green), villin (red), and DAPI (blue). Boxed region indicates field shown in zoomed images. Arrows point to distal tip enrichment of Myo7b within the BB. Scale bar, 20 μm. (C) Confocal images of mouse kidney tissue stained for Myo7b (green) and villin (red). Boxed area indicates region in zoomed images. Arrows point to distal tip enrichment of Myo7b within the BB. Scale bar, 50 μm. (D) Structure illumination microscopy of CACO-2BBE cells overexpressing full-length Myo7b N-terminally tagged with EGFP (green) and stained for F-actin (red). Boxed areas indicate regions in zoomed images. Arrows highlight distal tip enrichment. Scale bar, 5 μm. (E) Line scans of Myo7b intensity parallel to the microvillar axis in tissue sections or CACO-2BBE cells overexpressing EGFP-Myo7b; 0=base and 1=tip. N = 55 scans for SI, 53 scans for kidney, and 62 scans for CACO-2BBE. Gaussian curve fits are marked with length at peak intensity (LPI) ± distribution width (SD). See also Figure S1.

