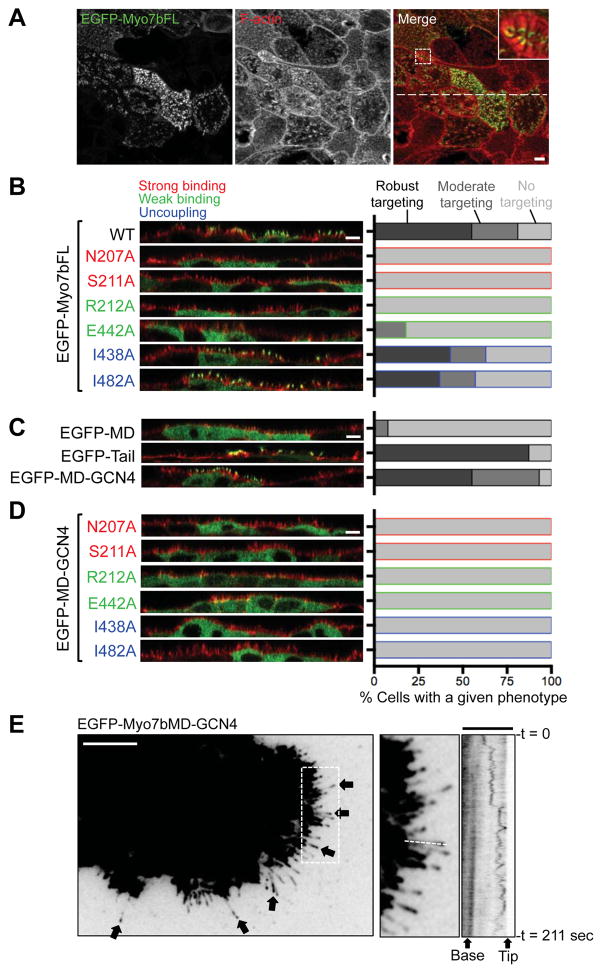
Figure 4. Structure-function analysis of Myo7b tip targeting.
(A) Confocal images of full-length EGFP-tagged Myo7b (green) stable overexpression in LLC-PK1-CL4 cells stained for F-actin (red) at 4 DPC. Boxed area indicates region in zoomed inset. Dashed line indicates WT X-Z vertical section shown in (B). Scale bar, 5 μm. (B) Vertical sections from confocal images of cells expressing EGFP-tagged full-length Myo7b constructs (EGFP-Myo7bFL) with point mutations indicated. Quantification of tip targeting in each case was performed by binning tip:cytoplasmic intensity ratios into three categories as indicated. Scale bar, 5 μm. (C) Vertical sections from confocal images of cells expressing EGFP-tagged Myo7b motor domain (EGFP-MD), Myo7b tail domain (EGFP-Tail), or a forced dimer of Myo7b motor domains (EGFP-MD-GCN4), quantified as in (B). Scale bar, 5 μm. (D) Vertical sections from confocal images of cells expressing a forced dimer of Myo7b motor domains (EGFP-MD-GCN4) with point mutations indicated, quantified as in (B). Scale bar, 5 μm. (E) TIRF images of a Cos-7 cell co-transfected with mCherry-fascin (not shown) and the EGFP-tagged Myo7b forced dimer construct (EGFP-MD-GCN4). Black arrows point to filopodial tip enrichment. Boxed area indicates region in zoomed image and Movie S1. Dashed line indicates line used to generate accompanying kymograph. Scale bars, 10 μm; 3.5 μm in kymograph. See also Figure S4 and Movie S1.

