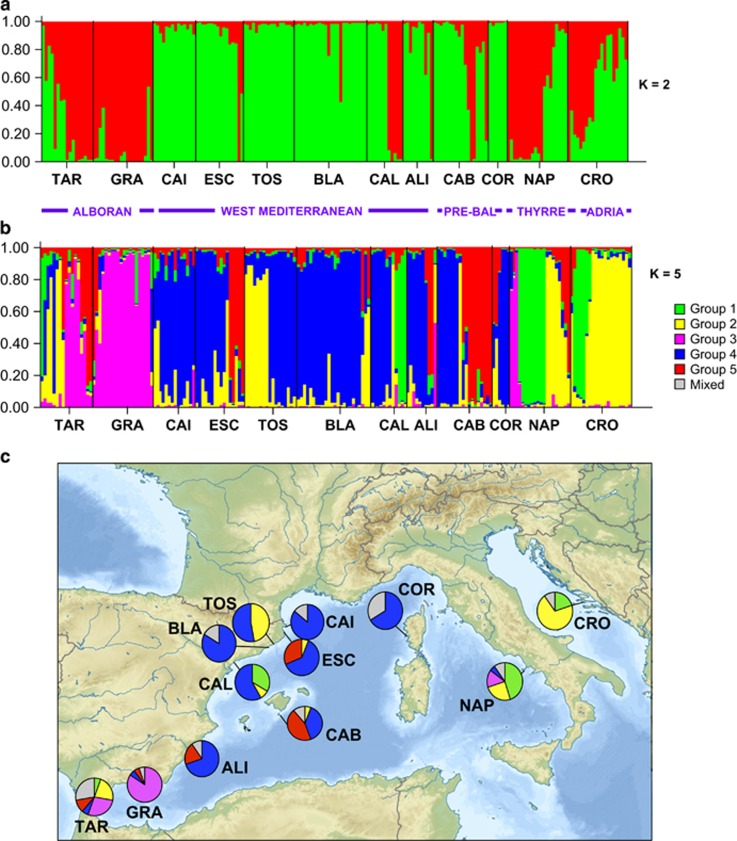
Figure 1.
Assignment of individual genotypes of I. fasciculata to genetically similar clusters (K) as inferred by STRUCTURE for all studied locations with (a) K=2 and (b) K=5. (c) Pie frequency charts showing percentage of populations assigned to each of the five clusters represented in (b) for all locations. Gray color is applied to the percentage of individuals that were assigned to more than one cluster. Pre-Bal, Pre-Balear islands; Thyrre, Thyrrenian Sea; Adria, Adriatic Sea. A full color version of this figure is available at the Heredity journal online.

