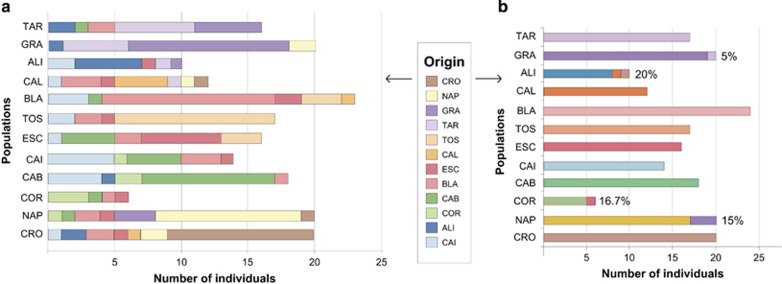
Figure 5.
Population assignment of individuals and last-generation migrants in I. fasciculata. (a) Number of individuals assigned to each population for all sampling locations. (b) Number of last-generation migrants (indicated in percentage of population). The original location of migrants (origin) is color coded following the same scheme as in DAPC of Figure 4a. A full color version of this figure is available at the Heredity journal online.

