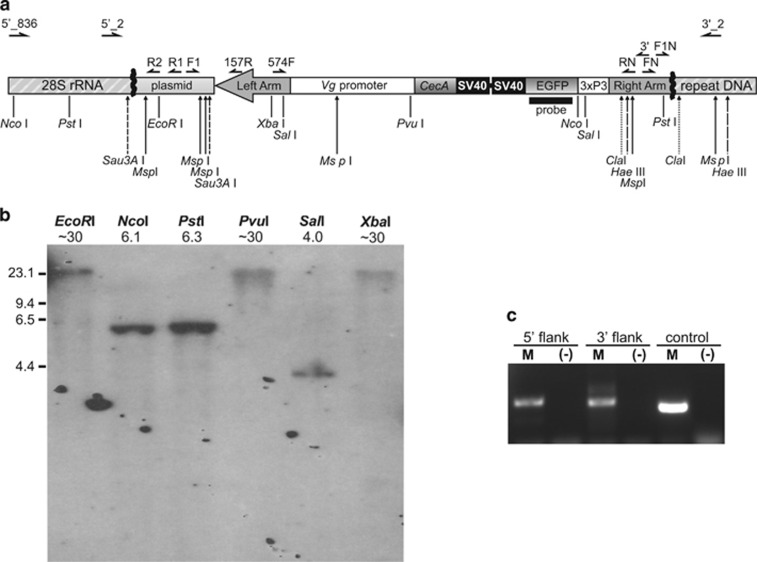
Figure 1.
The piggyBac transgene integration into the A. aegypti C42 strain genome. (a) A map of the construct flanked by the identified genomic DNA (not drawn to scale). Approximate positions of inverse PCR primers used to isolate the junctions between the transgene and flanking genomic DNA (thick zigzag lines) are marked directly above the map. Primer names are abbreviated for clarity; see Supplementary Table S1 for complete names and sequences of the primers. Target sites of the restriction enzymes used to generate templates for inverse PCR are marked as vertical bars below the map. Primers used to verify integrity of the junctions are shown at the top of the figure. Target sites of the endonucleases used for Southern blot analysis are marked by long vertical arrows below the map; for clarity target sites for different enzymes are represented by different arrow styles. Solid horizontal line represents a DNA fragment used as a probe in Southern blot analysis. (b) Southern blot analysis of the C42 males carrying the EGFP tag. Names of the restriction enzymes used for DNA digestion and sizes of the hybridizing fragments (in kb) are shown above the lanes. The position of the HindIII digested Lambda DNA fragments used as a high-molecular-weight marker is indicated on the left. (c) A PCR confirming integrity of the junctions in the EGFP-positive individuals. See Materials and methods for primer combinations used. Quality of the template DNA was evaluated using the EGFP-specific primers (control).

