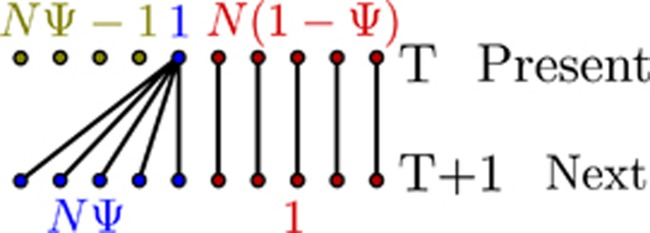
Figure 2.
Depiction of the modified Moran model underlying the Ψ-coalescent. Lineages between the present and the next generation, where N is the population size, ɛ is the probability of a sweepstake event and Ψ is the fraction of the population that is replaced in each such event. Labels in the top row give the number of parental individuals reproducing in a given manner (represented by color), whereas labels in the bottom row give the number of corresponding offspring per parent.

