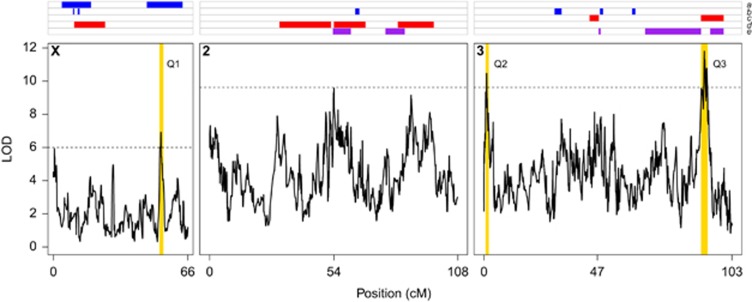
Figure 2.
Genome scan for QTLs contributing to sex comb tooth number variation. The bottom three panels show a genome scan in the DSPR for sex comb tooth number QTLs (solid curve) along each of the major fly chromosomes. Genetic positions 54 and 47 on chromosomes 2 and 3, respectively, represent the positions of centromeres. The horizontal dashed lines represent genome-wide 5% permutation thresholds (X: LOD=6.0, autosomes: LOD=9.6). The 3-LOD drop intervals implicated by the three QTLs we map (Q1, Q2, Q3) are highlighted as vertical yellow bars. The top panel shows the positions of sex comb QTLs mapped in five previous studies: a, within D. melanogaster (blue; Nuzhdin and Reiwitch, 2000); b, within D. melanogaster (blue; Kopp et al., 2003); c, between D. simulans and D. mauritiana (red; True et al., 1997); d, between D. simulans and D. sechellia (red; Macdonald and Goldstein, 1999); e, within D. simulans (purple; Tatsuta and Takano-Shimizu, 2006). In placing the QTLs mapped in studies c–e on our map we have accounted for the large chromosome 3R paracentric inversion that is fixed between D. melanogaster and D. mauritiana/D. sechellia/D. simulans (see Materials and methods).

