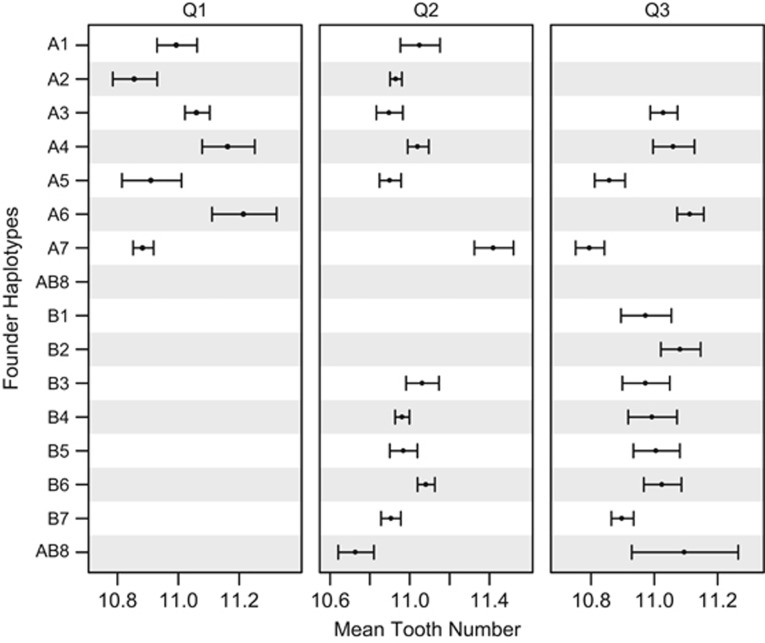
Figure 3.
Founder haplotype effects for mapped QTLs. Phenotype means (and s.e.) are presented for each founder at the peak position of each QTL. Data are only presented for founders present in at least 10 RILs at a probability of >0.95. AB8 was used to found both synthetic populations, and hence is depicted twice in the figure. Given that we phenotyped males resulting from crosses between population A females and population B males, for the X-linked Q1 only means for population A founders can be estimated.

