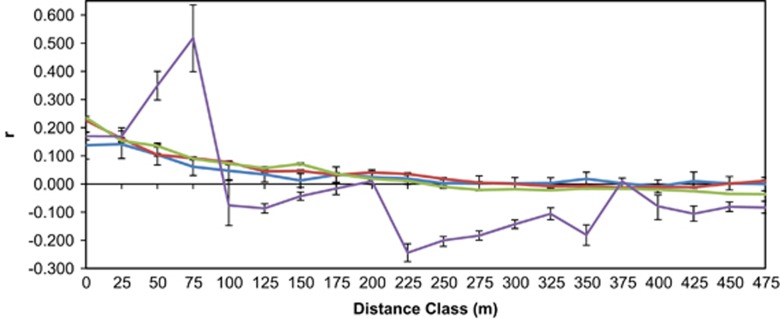
Figure 4.
Overlaid SGS autocorrelation plots for up to 500 m, even-distance classes in 25 m intervals, for all Koompassia malaccensis adults (light blue, N=179), MacRitchie recruits (red, N=1100), Bukit Timah recruits (green, N=812) and Botanic Garden recruits (purple, N=101); r, relatedness value of Queller and Goodnight (1989). Bars are 95% confidence intervals (CIs). Individual patch autocorrelation plots up to the maximum distance class within each patch are shown in Supplementary Figures S1a–c.

