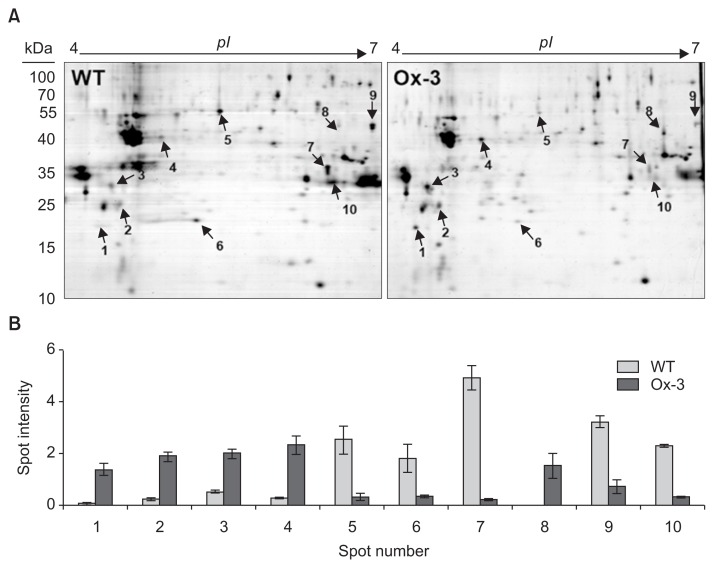
Fig. 5.
Proteomic analysis of jasmonic inducible pathogenesisrelated class 10 (JIOsPR10) overexpression plants showing a different protein expression profile as compared to the wild type (WT). (A) Gel map of 2-DE analysis. Same amount of total rice leaf proteins were separated on 2-DE gels, and stained with Coomassie brilliant blue. Arrows indicate the differentially expressed protein spots. (B) On-gel intensity of each protein spots in WT and overexpression plants. Error bars represent standard error of three biological replicates of experiments. pI, isoelectric point.

