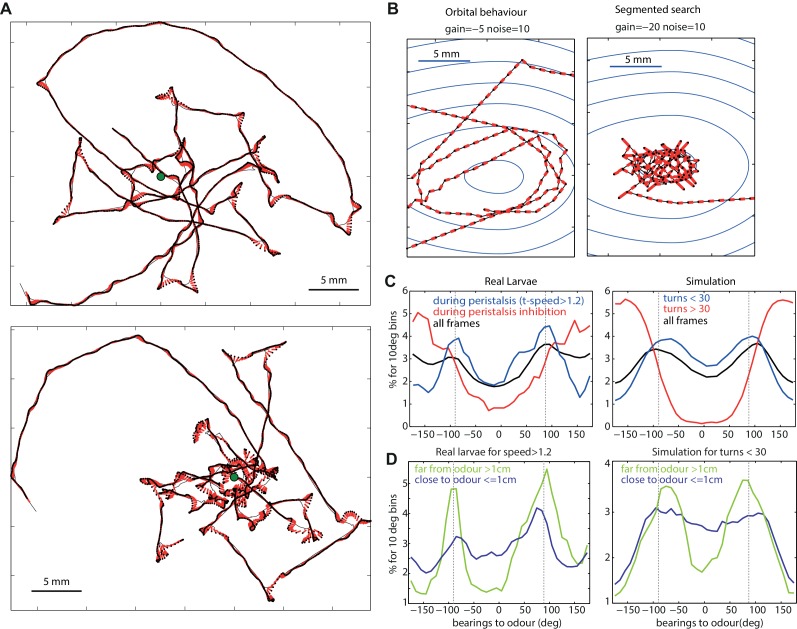
Figure 4. Typical path signatures for larvae and simulation.
(A,B) Example of paths. (C,D) Distributions of bearings to odour. Both larvae and simulated agents tend to spend most time with the odour located on their sides (−90 and 90 degrees), orbiting the source. In both larvae and simulation, orbital behaviour is emphasized during peristalsis forward motion (turn < 30 degrees for the model) (C blue curve), and when the larvae/agent is more than 1cm away from the odour (D green curve). Crossing-over trajectories, by contrast, are constituted of regular large turns that happen mostly while the larvae/agent is heading away from the odour (C red curve) and is rather apparent when the larvae/agent is close to the odour (D blue curve).

