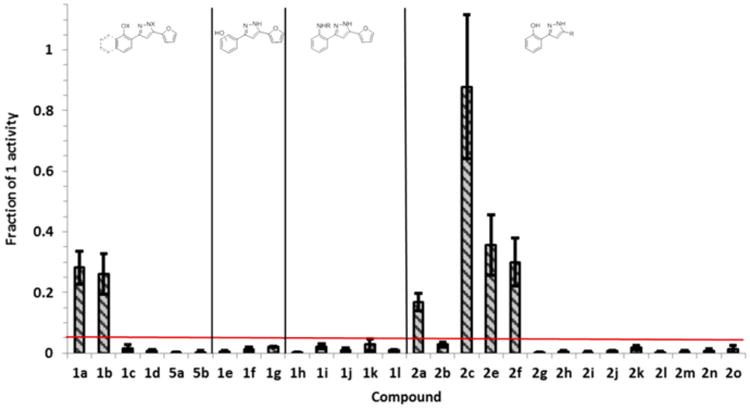
Figure 4.

Identification of HssRS activators by XylE assay. Activation of HssRS is presented as the fraction of activation by the indicated derivative relative to 1 at 50 μM. Data are the average of three replicates. Error bars represent one standard deviation from the mean. The red bar indicates the cutoff value for activity (above = active; below = inactive).
