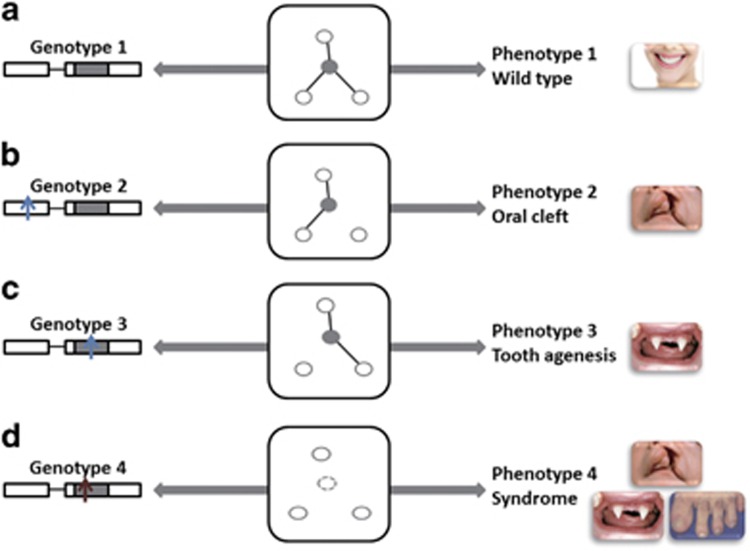
Figure 4.
The edgetic perturbation model. Different MSX1 variants might have different effects on the MSX1 network. Compared to the wild type genotype with full interaction (a), loss of some interaction (b and c), or loss of all interaction (node removal, d), leads to different phenotypes. Blue arrows represent the in frame mutations; red arrows are the truncating. Nodes represent molecules, and edges represent interactions between them. A full color version of this figure is available at the European Journal of Human Genetics journal online.

