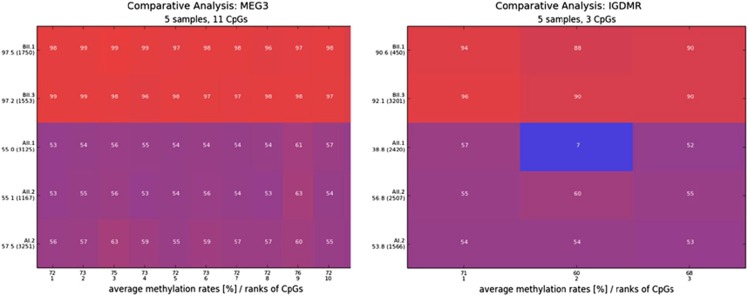
Figure 2.
Comparative methylation heatmap obtained by next-generation bisulfite sequencing of MEG3 and the DLK1/MEG3 IG-DMR. Patient BII.1 and BII.3 showed hypermethylation due to the deletion of the unmethylated maternal allele at both loci, whereas patients AII.1 and AII.2 and their mother showed normal methylation values around 50%. Patient AII.1 showed hypomethylation at CpG2 of the IG-DMR because she is heterozygous or homozygous for a C to T exchange (rs1458662425:C>T (hg19. chr14:g.101277356C>T)) on the methylated paternal allele. Each square represents a CpG dinucleotide with its average methylation level and each line a specific sample. The average methylation over the analyzed region is given in percentage under the individual sample together with the number of analyzed reads in brackets. The methylation was analyzed over 11 CpGs at the MEG3-DMR and 3 CpGs at the DLK1/MEG3 IG-DMR. A full color version of this figure is available at the European Journal of Human Genetics journal online.

