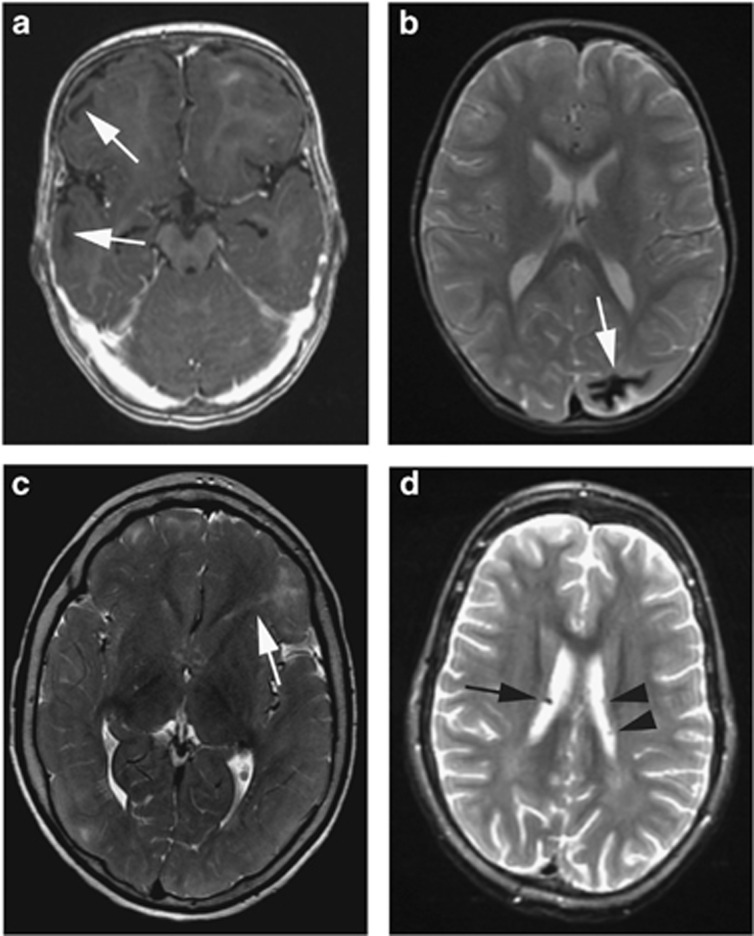
Figure 4.
Examples of TSC-specific brain abnormalities assessed in this study. (a) T1 sequence showing cystic cortical tubers (arrows). (b) T2 sequence showing a calcified cortical tuber (arrow). (c) T2 sequence showing an RML in the left frontal lobe (arrow). (d) T2 dual echo sequence showing a calcified SEN (arrow). Note the SENs without calcification in the other ventricle (arrowheads). SEN, subependymal nodule; TSC, Tuberous Sclerosis Complex.

