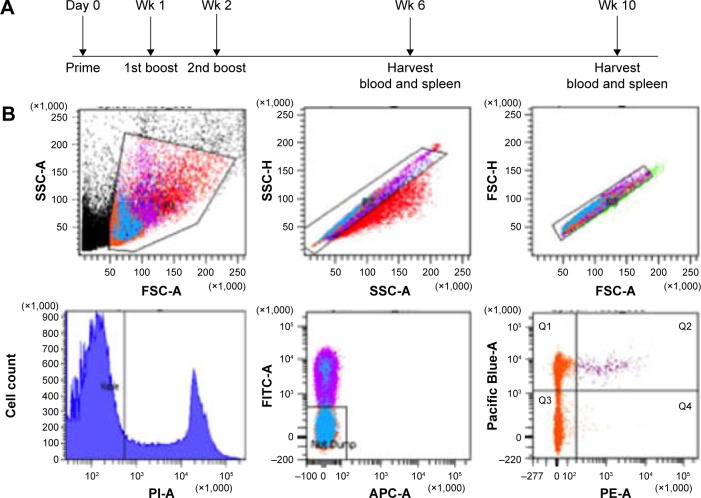
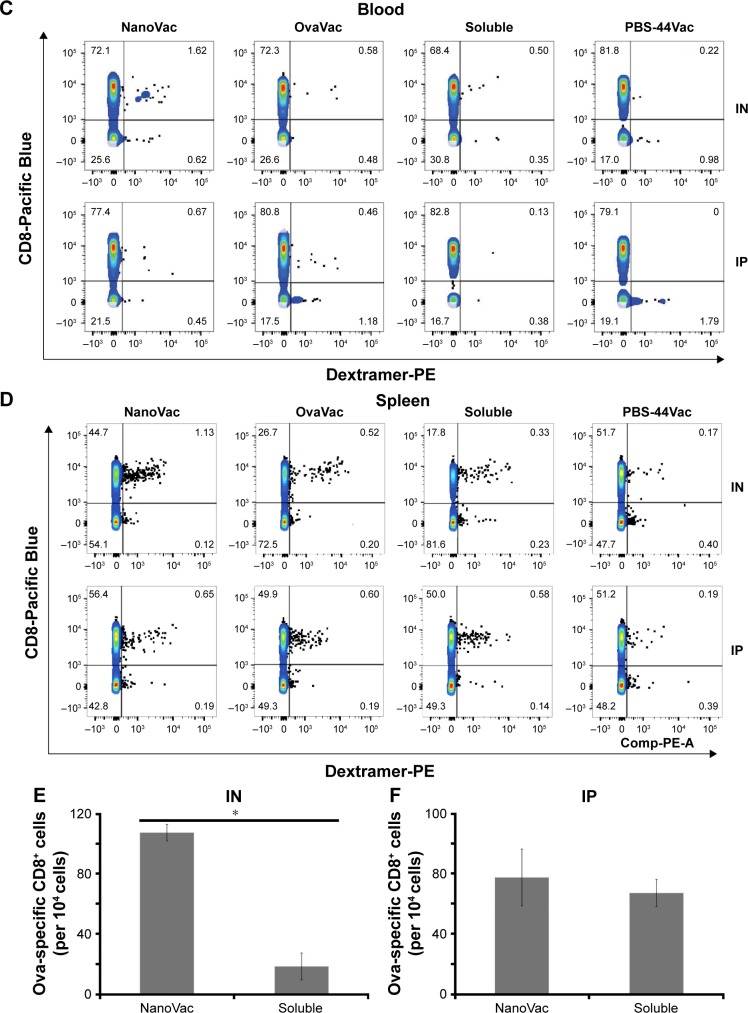
Figure 5.
Ova-specific CD8+ T cells at 6 weeks postpriming.
Notes: (A) Timeline of in vivo treatments. (B) Gating strategy to quantify ova-specific CD8+ T cells. Top row from left to right: selection of lymphocyte, selection of single cell to exclude doublets and cell clumps; bottom row from left to right: selection of live cells, exclusion of CD4+ cells, B cells, DCs, monocytes, and NK cells, selection of double-positive cells – ova-specific CD8+ cells. (C and D) Measurement of ova-specific CD8+ T cells from either peripheral blood or spleen by flow cytometry at 6 weeks after priming by IN or IP administration route. Data presented are representative of three mice. (E and F) The absolute number of ova-specific CD8+ cells from spleen; each bar represents the value of the average from a group of three mice. *P<0.01.
Abbreviations: DC, dendritic cell; IN, intranasal; IP, intraperitoneal; NK, natural killer; wk, week.


