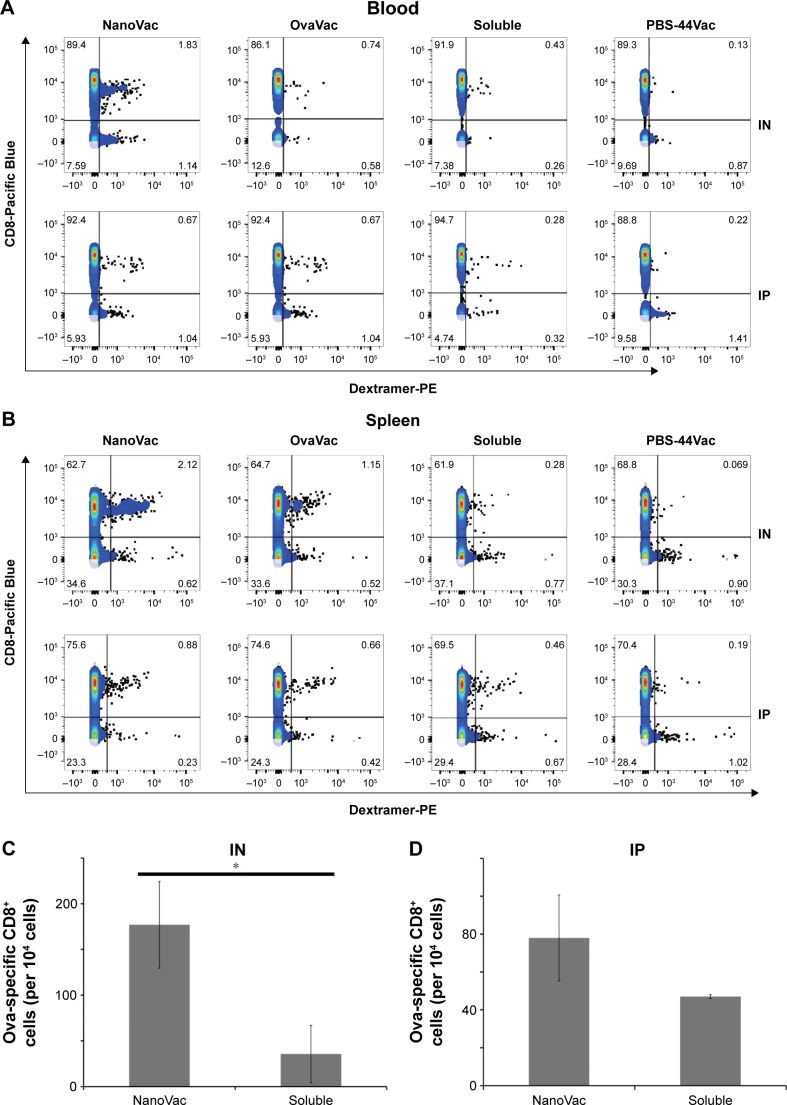
Figure 6.
Ova-specific CD8+ T cells at 10 weeks postpriming.
Notes: (A and B) Measurement of ova-specific CD8+ T cells from either peripheral blood or spleen by flow cytometry at 10 weeks after priming by either IN or IP route. The data are representative of three mice. (C and D) The absolute number of ova-specific CD8+ cells from the spleens. Each bar represents the value of the average from a group of three mice or more. (E–G) Quantitative analysis of the cytokines in mouse serum at 10 weeks after priming with either IN or IP administration, performed by ELISA. Each bar represents the value of an average from three samples, and each sample is in triplicate. *P<0.01.
Abbreviations: ELISA, enzyme-linked immunosorbent assay; IFN-γ, interferon-γ; IL, interleukin; IN, intranasal; IP, intraperitoneal.


