
Figure 1.
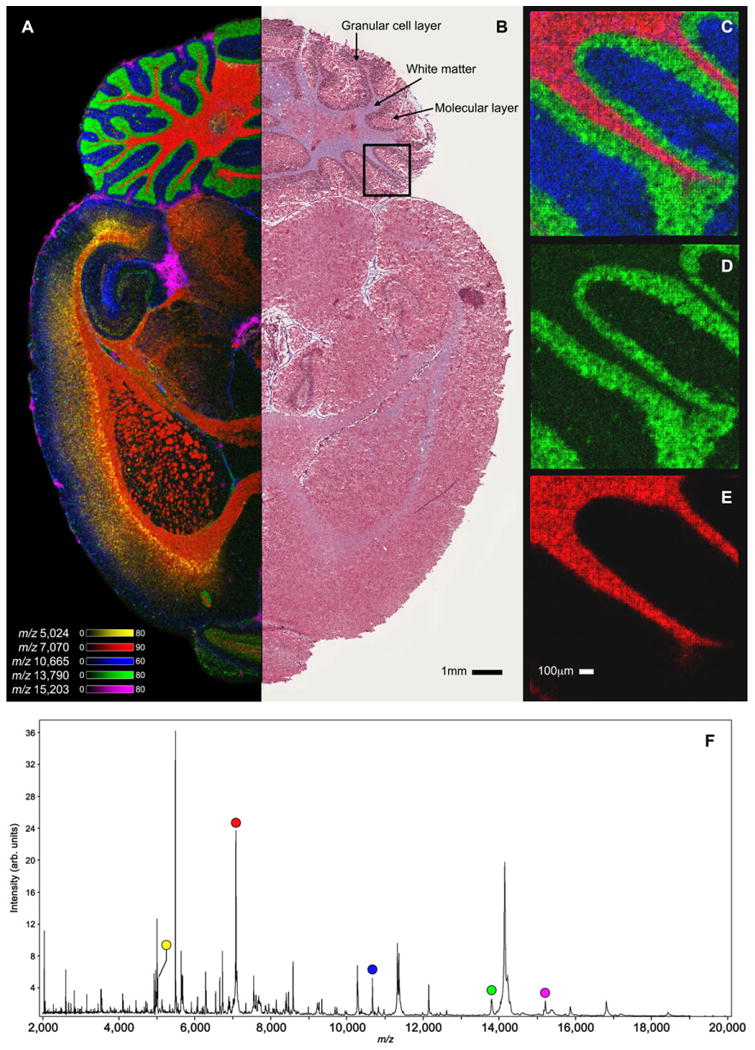
Selected ion images of transversally sectioned rat brain tissue collected using ultra-high throughput MALDI-TOF IMS. Observed substructures in the overlaid 30 μm ion image (A) of m/z 5024 (yellow), m/z7070 (red), m/z 10 665 (blue), m/z 13 790 (green) and m/z 15 203 (pink) were consistent with the trichrome staining following IMS acquisition (B). High spatial resolution (10 μm) ion images were collected from the area outlined in black (C–E). The overall average spectrum for the 30 μm imaging experiment is shown in (F) highlighting each peak for the ions in (A).