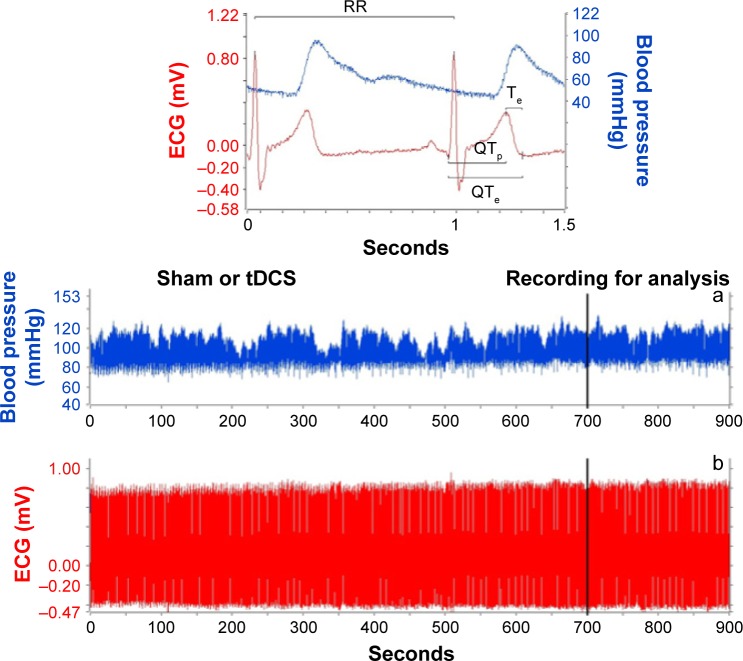
Figure 2.
An example of a 15-minute recording during sham or real anodal transcranial direct current stimulation (tDCS).
Notes: (a) shows in detail the examined electrocardiogram (ECG) and blood pressure variables (b). The following intervals were measured: RR, QTe (from the Q wave to the T wave end), QTp (from the Q wave to the T wave peak), and Te (difference between QTe and QTp).

