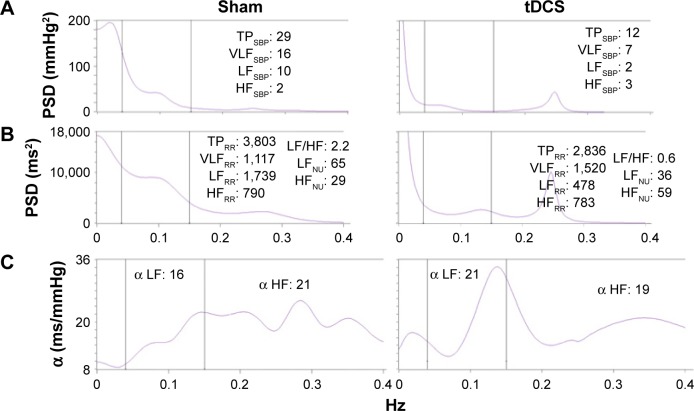
Figure 4.
(A) shows the spectrum for SBP, (B) shows the R–R variability spectrum, and (C) shows the index during sham (left panel) or active tDCS (right panel).
Notes: Alpha indexes: the relationship between the square root of a single spectral component of R–R variability (LF or HF) and the square root of the same spectral component for SBP. The (C) shows the three spectral windows considered: a LF power (0.04–0.15 Hz) and a HF power (0.15–0.40 Hz). R–R and arterial pressure variability were recorded simultaneously during controlled breathing. Note the increased HFNU and decreased LFNU and LF: HF during tDCS, a pattern reflecting a sinus vagal increase and sinus sympathetic decrease. LF:HF, ratio between LF and HF.30,35
Abbreviations: SBP, systolic blood pressure; tDCS, transcranial direct current stimulation; LF, low frequency; HF, high frequency; TP, total power; VLF, very low-frequency; NU, normalized units; PSD, power spectral density.

